Unlock a world of possibilities! Login now and discover the exclusive benefits awaiting you.
- Qlik Community
- :
- All Forums
- :
- QlikView App Dev
- :
- Re: Missing columns in pivot table / show upon sel...
- Subscribe to RSS Feed
- Mark Topic as New
- Mark Topic as Read
- Float this Topic for Current User
- Bookmark
- Subscribe
- Mute
- Printer Friendly Page
- Mark as New
- Bookmark
- Subscribe
- Mute
- Subscribe to RSS Feed
- Permalink
- Report Inappropriate Content
Missing columns in pivot table / show upon selection
Hi there,
I have an issue with some missing columns in a pivot table 
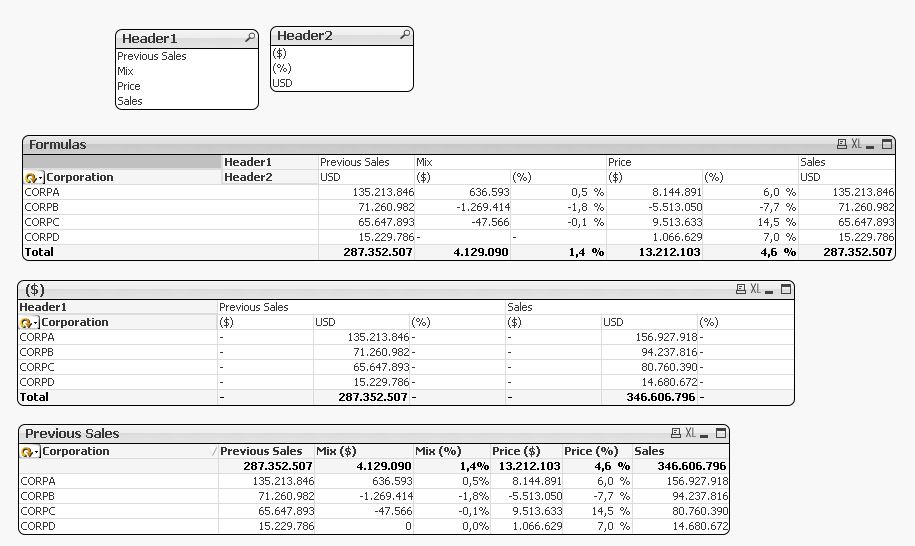
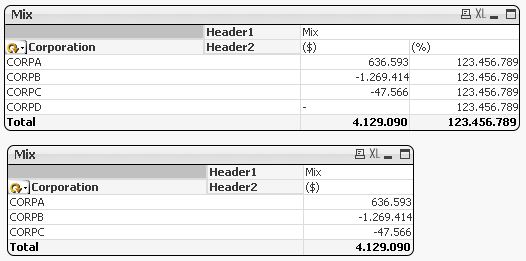
As it can be seen in the previous image, I have a pivot table with 3 dimensions, Corporation, Header1 and Header2.
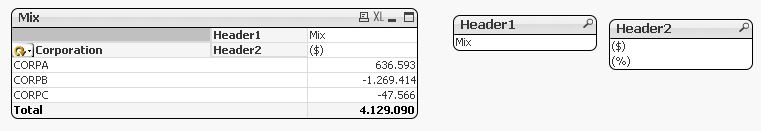
With the current expression, the table shows only Header2 value '($)' and it should display both '($)' and '(%)', since no value for Header2 is selected.
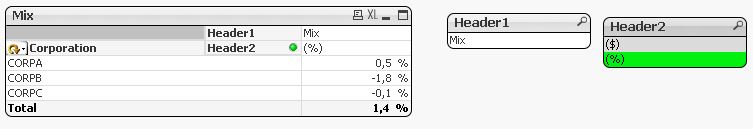
At first, I thougt it was something with the formula, but if I select '(%)' from Header2, the respective value is displayed as expected:
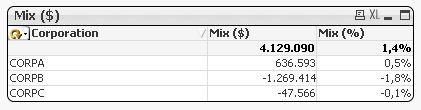
What I need is to show both values at the same time, but with a header grouping the information so it wouldn't be repetitive as in a straight table:
I was able to solve the layout issue with the inline table created in the QVW file attached, but now some of the expressions do not show, unless the respective value of the header is selected.
As I said, following attached is the QVW file an its source XLS.
Thanks in advance!
Update:
I added 2 more pivot tables in the QVW:
On the first, I used some random number instead of the formula and it shows both columns as it should.
And on the second, I used the exact same formula in the first column, which is already showing, but even so, it was not displayed.
Accepted Solutions
- Mark as New
- Bookmark
- Subscribe
- Mute
- Subscribe to RSS Feed
- Permalink
- Report Inappropriate Content
Hi Marcos, try adding the NODISTINCT clause to each Aggr() so it repeats calculations when it founds the same value dimensions in different cells:
Aggr( NODISTINCT ... )
Adding Header1 and Header2 to the dimensions in each Aggr() should also work:
Aggr( ...., dimension1, dimension2, header1, header2)
- Mark as New
- Bookmark
- Subscribe
- Mute
- Subscribe to RSS Feed
- Permalink
- Report Inappropriate Content
Why not make the "Header"-columns with "Enable" conditional? !
- Mark as New
- Bookmark
- Subscribe
- Mute
- Subscribe to RSS Feed
- Permalink
- Report Inappropriate Content
Hi Marcos, try adding the NODISTINCT clause to each Aggr() so it repeats calculations when it founds the same value dimensions in different cells:
Aggr( NODISTINCT ... )
Adding Header1 and Header2 to the dimensions in each Aggr() should also work:
Aggr( ...., dimension1, dimension2, header1, header2)
- Mark as New
- Bookmark
- Subscribe
- Mute
- Subscribe to RSS Feed
- Permalink
- Report Inappropriate Content
Hi Johan,
Your answer was helpful, but in my example I used just the Mix Column, and in the real app I would need more columns.
So it didn't worked when adding more columns.
The below answer worked ok, I'll attach the QVW file with the solution.
- Mark as New
- Bookmark
- Subscribe
- Mute
- Subscribe to RSS Feed
- Permalink
- Report Inappropriate Content
Thanks a lot Ruben!
That was exactly it!
Attached is the solution.
The first table is the correct, the second is the variation of Johan solution and the third is the correct view in a straight table.