Unlock a world of possibilities! Login now and discover the exclusive benefits awaiting you.
- Qlik Community
- :
- All Forums
- :
- QlikView App Dev
- :
- Min and Max Date inside set Analysis - QlikView
- Subscribe to RSS Feed
- Mark Topic as New
- Mark Topic as Read
- Float this Topic for Current User
- Bookmark
- Subscribe
- Mute
- Printer Friendly Page
- Mark as New
- Bookmark
- Subscribe
- Mute
- Subscribe to RSS Feed
- Permalink
- Report Inappropriate Content
Min and Max Date inside set Analysis - QlikView
Hi guys,
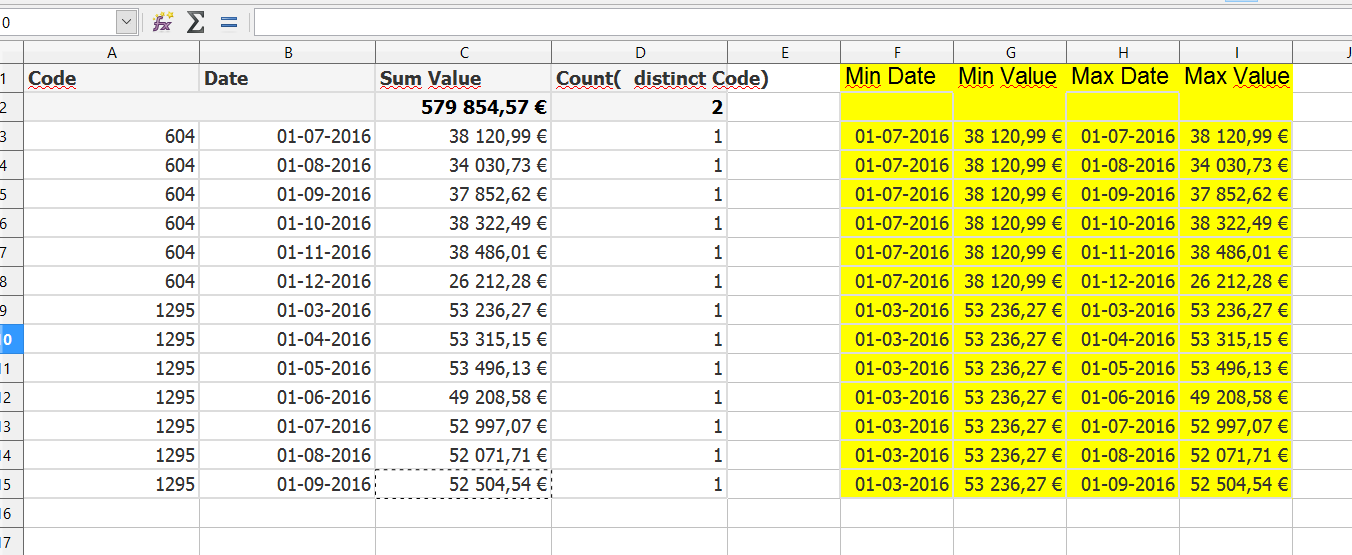
I've attached an qvw sample and a excel file with the expected output. See Sheet 2 of qvw app.
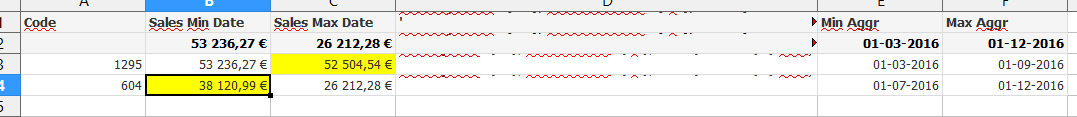
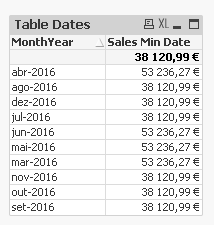
In table Table Dates, I want to show the sum of value of the min date and max date of each code, using FactFaseActive = P
Showing only the dates corresponding to each code I can get the correct dates,
but using that formula in set analysis for sum sales, I can't.
It only gives the min and max of all dates.
Can you please help?
How can I get to the expected output (in yellow)?
Thanks in advanced,
Sílvia
- « Previous Replies
-
- 1
- 2
- Next Replies »
Accepted Solutions
- Mark as New
- Bookmark
- Subscribe
- Mute
- Subscribe to RSS Feed
- Permalink
- Report Inappropriate Content
Try these:
FirstSortedValue(Aggr(SUM ({<
Metric = {"Sales"}
, FactProjActive={"1"}, FactFaseActive={"P"}>}[Value]), Code, Date), Aggr(Only({<FactFaseActive={"P"}>}Date), Code, Date))
/
Count(distinct
{<FactProjActive={"1"}, FactFaseActive={"P"}>} Code)
FirstSortedValue(Aggr(SUM ({<
Metric = {"Sales"}
, FactProjActive={"1"}, FactFaseActive={"P"}>}[Value]), Code, Date), -Aggr(Only({<FactFaseActive={"P"}>}Date), Code, Date))
/
Count(distinct
{<FactProjActive={"1"}, FactFaseActive={"P"}>} Code)
- Mark as New
- Bookmark
- Subscribe
- Mute
- Subscribe to RSS Feed
- Permalink
- Report Inappropriate Content
Hello Sunny 
That works, thanks.
Now, another question.
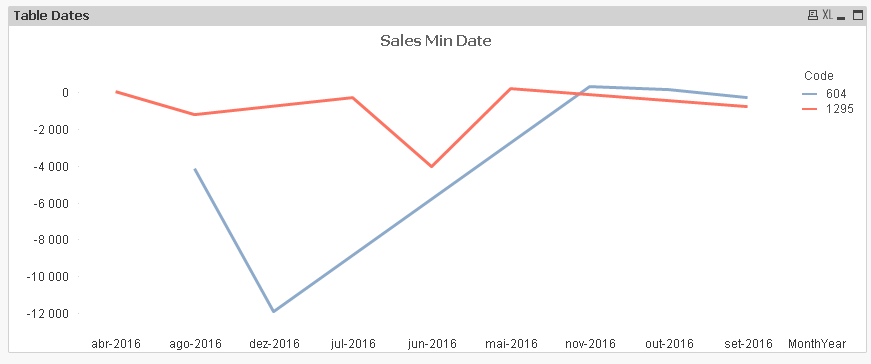
I want to show that values in a line char.
So for each ccode dimension, I want the min Date of all total dates off that code, and my max date is the current date.
Example: (see attached xls file)
Thanks,
Sílvia
- Mark as New
- Bookmark
- Subscribe
- Mute
- Subscribe to RSS Feed
- Permalink
- Report Inappropriate Content
Not entirely sure I understand
- Mark as New
- Bookmark
- Subscribe
- Mute
- Subscribe to RSS Feed
- Permalink
- Report Inappropriate Content
What would be the chart dimension here?
- Mark as New
- Bookmark
- Subscribe
- Mute
- Subscribe to RSS Feed
- Permalink
- Report Inappropriate Content
Hi Sunny,
The chart dimension would be MonthYear.
I want the evolution variation for monthYear, in which my min MonthYear is always the min date of that Code.
Example
In line chart, I want dimension = MonthYear
And for Code = 604 I want:
in MonthYear = 09-2016, [sum(Value) of Max(MonthYear)] - [sum(Value) of Min(MonthYear)]
in MonthYear = 08-2016, [sum(Value) of 08-2016] - [sum(Value) of 07-2016]
in MonthYear = 09-2016, [sum(Value) of 09-2016] - [sum(Value) of 07-2016]
in MonthYear = 09-2016, [sum(Value) of 10-2016] - [sum(Value) of 07-2016]
etc
Sílvia
- Mark as New
- Bookmark
- Subscribe
- Mute
- Subscribe to RSS Feed
- Permalink
- Report Inappropriate Content
Like this?
- Mark as New
- Bookmark
- Subscribe
- Mute
- Subscribe to RSS Feed
- Permalink
- Report Inappropriate Content
Yes, Sunny like this.
But when then I want to remove the dimension Code.
So that when I select a Code it shows values for that Code, and when I choose more than one Code it shows values for both that Codes.
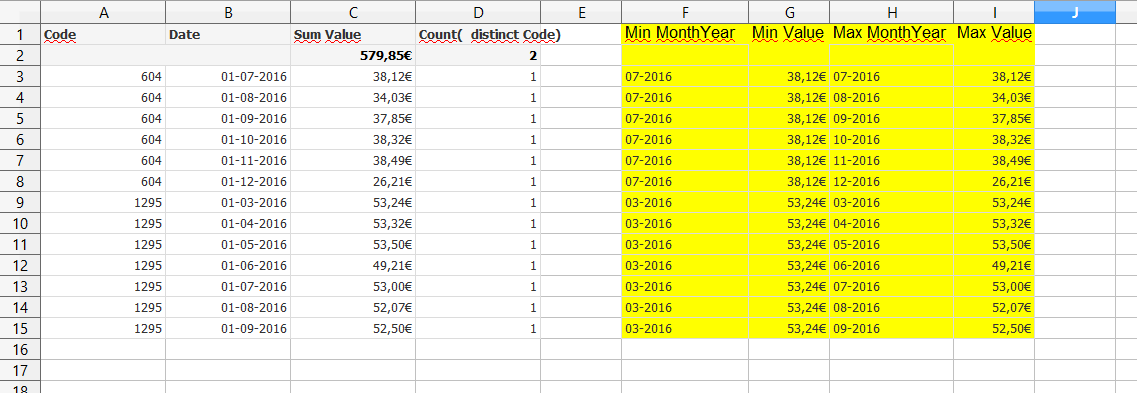
So when I put this in a table, like the above, I want that in out-2016, nov-2016 and dez-2016 the Min Month Value to show 38 120,99€.
Because in that months Code = 604 is the only one in FactFaseActive = P.
But since there is no Code dimension it's giving the min date of both Code, despite the fact that Code 1295 is not in FactFaseActive P in those periods.
So where it's pink, I want it to show 38 120,99€
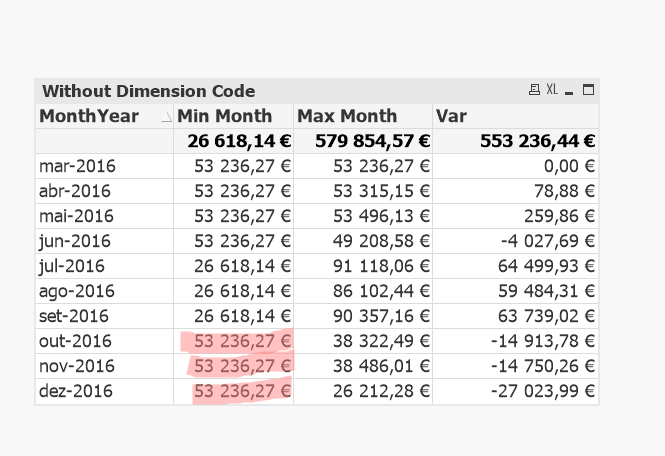
Sílvia
- Mark as New
- Bookmark
- Subscribe
- Mute
- Subscribe to RSS Feed
- Permalink
- Report Inappropriate Content
May be this:
Min(Aggr(FirstSortedValue(TOTAL <Code>Aggr(SUM ({<
Metric = {"Sales"}
, FactProjActive={"1"}, FactFaseActive={"P"}>}[Value]), Code, Date), Aggr(Only({<FactFaseActive={"P"}>}Date), Code, Date))
/
Count(distinct
{<FactProjActive={"1"}, FactFaseActive={"P"}>} Code), Code, MonthYear))
It might be easier if you can share the app where you make changes because I don't have to guess what changes you have made at your end.
- Mark as New
- Bookmark
- Subscribe
- Mute
- Subscribe to RSS Feed
- Permalink
- Report Inappropriate Content
Thank you Sunny, and sorry, I did forget to attach the sample.
Once again thank you for your help.
Sílvia
- « Previous Replies
-
- 1
- 2
- Next Replies »