Unlock a world of possibilities! Login now and discover the exclusive benefits awaiting you.
- Qlik Community
- :
- All Forums
- :
- QlikView App Dev
- :
- Re: Line chart Date Formatting
- Subscribe to RSS Feed
- Mark Topic as New
- Mark Topic as Read
- Float this Topic for Current User
- Bookmark
- Subscribe
- Mute
- Printer Friendly Page
- Mark as New
- Bookmark
- Subscribe
- Mute
- Subscribe to RSS Feed
- Permalink
- Report Inappropriate Content
Line chart Date Formatting
Hi,
In my line chart's expresion I am calculating trend using set analysis and limiting it to current date to 30 day's back (One month trend)
Current date selection is being made by a calendar object.
If user selects 5/24 line chart should populate 4/24-5/24.
I have all this working but my line chart is showing all the dates 4/24, 4/25 4/26 ............................ 5/24.
Requirment Questions:
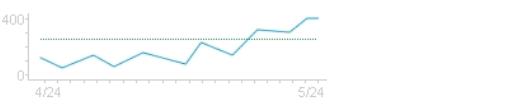
1) just show 4/24 nothing in between and 5/24 at the end as in image below
2) Currently I have date in MM/DD/YYYY format (4/24/2012) how can I change it to just MM/DD format in the chart
- « Previous Replies
-
- 1
- 2
- Next Replies »
- Mark as New
- Bookmark
- Subscribe
- Mute
- Subscribe to RSS Feed
- Permalink
- Report Inappropriate Content
- Mark as New
- Bookmark
- Subscribe
- Mute
- Subscribe to RSS Feed
- Permalink
- Report Inappropriate Content
A "workaround" would be to force the date to be displayed as text in Chart Properties>Presentation>Text in chart
- Mark as New
- Bookmark
- Subscribe
- Mute
- Subscribe to RSS Feed
- Permalink
- Report Inappropriate Content
Fernando,
How I can have dimension axis and not show date on it.?
- Mark as New
- Bookmark
- Subscribe
- Mute
- Subscribe to RSS Feed
- Permalink
- Report Inappropriate Content
Chart Properties>Dimensions>Settings for selected dimension>uncheck "Show legend".
- Mark as New
- Bookmark
- Subscribe
- Mute
- Subscribe to RSS Feed
- Permalink
- Report Inappropriate Content
If I do that its not showing the Dimension Axis at all
- « Previous Replies
-
- 1
- 2
- Next Replies »