Unlock a world of possibilities! Login now and discover the exclusive benefits awaiting you.
- Qlik Community
- :
- All Forums
- :
- QlikView App Dev
- :
- Line Chart with different style
- Subscribe to RSS Feed
- Mark Topic as New
- Mark Topic as Read
- Float this Topic for Current User
- Bookmark
- Subscribe
- Mute
- Printer Friendly Page
- Mark as New
- Bookmark
- Subscribe
- Mute
- Subscribe to RSS Feed
- Permalink
- Report Inappropriate Content
Line Chart with different style
Hello all,
I want to show a line chart into two style solid and dotted both in alternate way.
I tried to achieve same in Line Style property of Expression tab with If condition but it is doing for mentioned condition only.
But I want to make it follow at alternate level without any condition. Is it possible??
Example : Say I am having Year as dimension and Amount as Sales, now through line chart for year 2009-2010, it shud be a solid line then for 2010-2011 it shud be dotted line and so on...
Pls suggest.
Regards,
Balraj
- Tags:
- new_to_qlikview
- « Previous Replies
-
- 1
- 2
- Next Replies »
Accepted Solutions
- Mark as New
- Bookmark
- Subscribe
- Mute
- Subscribe to RSS Feed
- Permalink
- Report Inappropriate Content
- Mark as New
- Bookmark
- Subscribe
- Mute
- Subscribe to RSS Feed
- Permalink
- Report Inappropriate Content
Hi,
In Expressions Tab you can use in Line Style: if(Year=2010,'<S2>')
- Mark as New
- Bookmark
- Subscribe
- Mute
- Subscribe to RSS Feed
- Permalink
- Report Inappropriate Content
Sunny,
Two expression means, two different line?
But I want to do it in a single line with a single expression...
- Mark as New
- Bookmark
- Subscribe
- Mute
- Subscribe to RSS Feed
- Permalink
- Report Inappropriate Content
You want some like this??
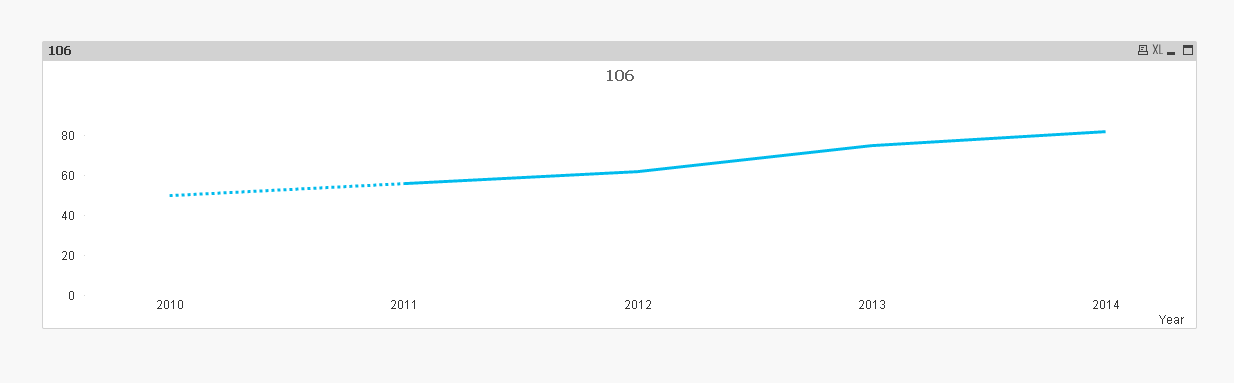
If yes, PFA
Best,
Sunny
- Mark as New
- Bookmark
- Subscribe
- Mute
- Subscribe to RSS Feed
- Permalink
- Report Inappropriate Content
Did not think of this method. I think this is the answer you are looking for.
- Mark as New
- Bookmark
- Subscribe
- Mute
- Subscribe to RSS Feed
- Permalink
- Report Inappropriate Content
No,
It should be in a alternate way...
As per your Year Dimension, 2010-2011 is a dotted, then it should repeat for 2012-2013 and then 2014-2015 so on...
- Mark as New
- Bookmark
- Subscribe
- Mute
- Subscribe to RSS Feed
- Permalink
- Report Inappropriate Content
Try:
if(Year=2010 or Year =2012 or Year= 2014,'<S2>')
- Mark as New
- Bookmark
- Subscribe
- Mute
- Subscribe to RSS Feed
- Permalink
- Report Inappropriate Content
try this:
if(Even(Year)=-1,'<S3>')
- Mark as New
- Bookmark
- Subscribe
- Mute
- Subscribe to RSS Feed
- Permalink
- Report Inappropriate Content
Works perfectly Federico Velasco. Balraj Ahlawat this gives exactly what you seems to be looking for:
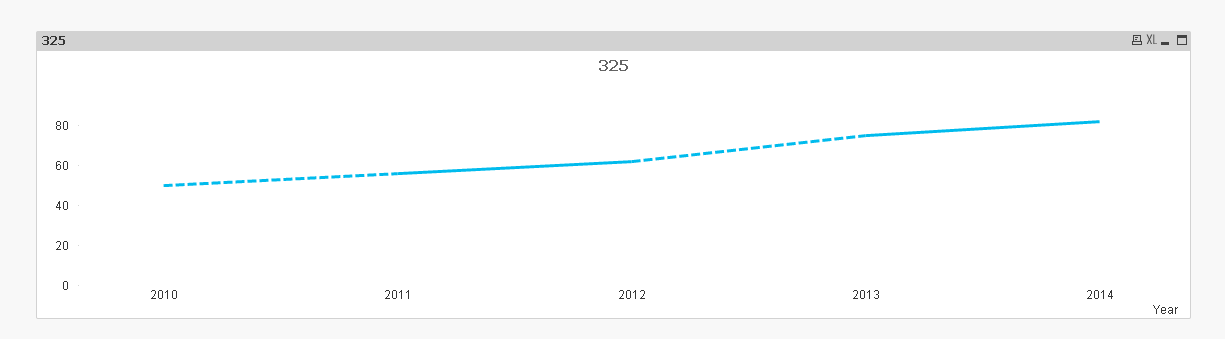
Great job Federico, thanks for showing us this.
Best,
Sunny
- Mark as New
- Bookmark
- Subscribe
- Mute
- Subscribe to RSS Feed
- Permalink
- Report Inappropriate Content
@fvelascog72 good work 
- « Previous Replies
-
- 1
- 2
- Next Replies »