Unlock a world of possibilities! Login now and discover the exclusive benefits awaiting you.
- Qlik Community
- :
- All Forums
- :
- QlikView App Dev
- :
- Issue with Monthly& Weekly avg
- Subscribe to RSS Feed
- Mark Topic as New
- Mark Topic as Read
- Float this Topic for Current User
- Bookmark
- Subscribe
- Mute
- Printer Friendly Page
- Mark as New
- Bookmark
- Subscribe
- Mute
- Subscribe to RSS Feed
- Permalink
- Report Inappropriate Content
Issue with Monthly& Weekly avg
Hello,
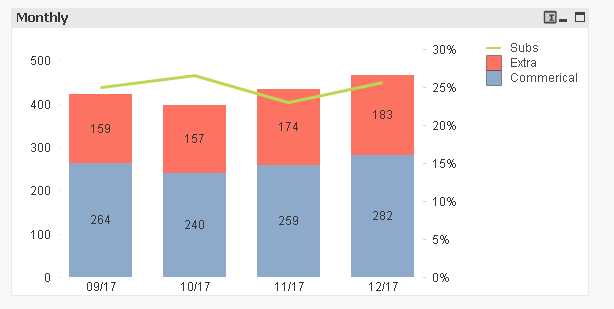
I am calculating monthly avg in combo chart, Issue is here when there is no month selection the chart is plotting Sep and Oct only but its not plotting Nov and Dec, If we select Nov and Dec from Month filter then i can see the bars. I am not sure is something wrong with my expression so looking for some help here. Please find the attached sample file.
Accepted Solutions
- Mark as New
- Bookmark
- Subscribe
- Mute
- Subscribe to RSS Feed
- Permalink
- Report Inappropriate Content
Try adding the dimensions within the Aggr() function
=if(only(Vehicle_Use) = 'LEASE',
Round(Avg(Aggr(count({<Vehicle_Use-={''},Unit_type-={''},Current_Cust_Number ={'699999','699998'},Rental_Source_Type ={'COMMERCIAL'}, Veh_Cap_Status-={''}>}RENTED_UNITS),Day, MonthName))),
Round(Avg(Aggr(count({<Vehicle_Use-={''},Unit_type-={''},Rental_Source_Type ={'COMMERCIAL'},Veh_Cap_Status-={''}>}RENTED_UNITS),Day, MonthName))))
For week, create a weekstart in the script and add that to aggr function also
- Mark as New
- Bookmark
- Subscribe
- Mute
- Subscribe to RSS Feed
- Permalink
- Report Inappropriate Content
I figured it out Sunny anyway thank you!!