Unlock a world of possibilities! Login now and discover the exclusive benefits awaiting you.
- Qlik Community
- :
- All Forums
- :
- QlikView App Dev
- :
- Influenza H1N1 Heat Map visualization
- Subscribe to RSS Feed
- Mark Topic as New
- Mark Topic as Read
- Float this Topic for Current User
- Bookmark
- Subscribe
- Mute
- Printer Friendly Page
- Mark as New
- Bookmark
- Subscribe
- Mute
- Subscribe to RSS Feed
- Permalink
- Report Inappropriate Content
Influenza H1N1 Heat Map visualization
Guys,
I found this site, that shows how influenza A is spreading on Americas.
http://new.paho.org/hq/images/atlas/en/atlas.html
Why not creating a demo for this information with Qlikview ?
- Mark as New
- Bookmark
- Subscribe
- Mute
- Subscribe to RSS Feed
- Permalink
- Report Inappropriate Content
Hi Pablo,
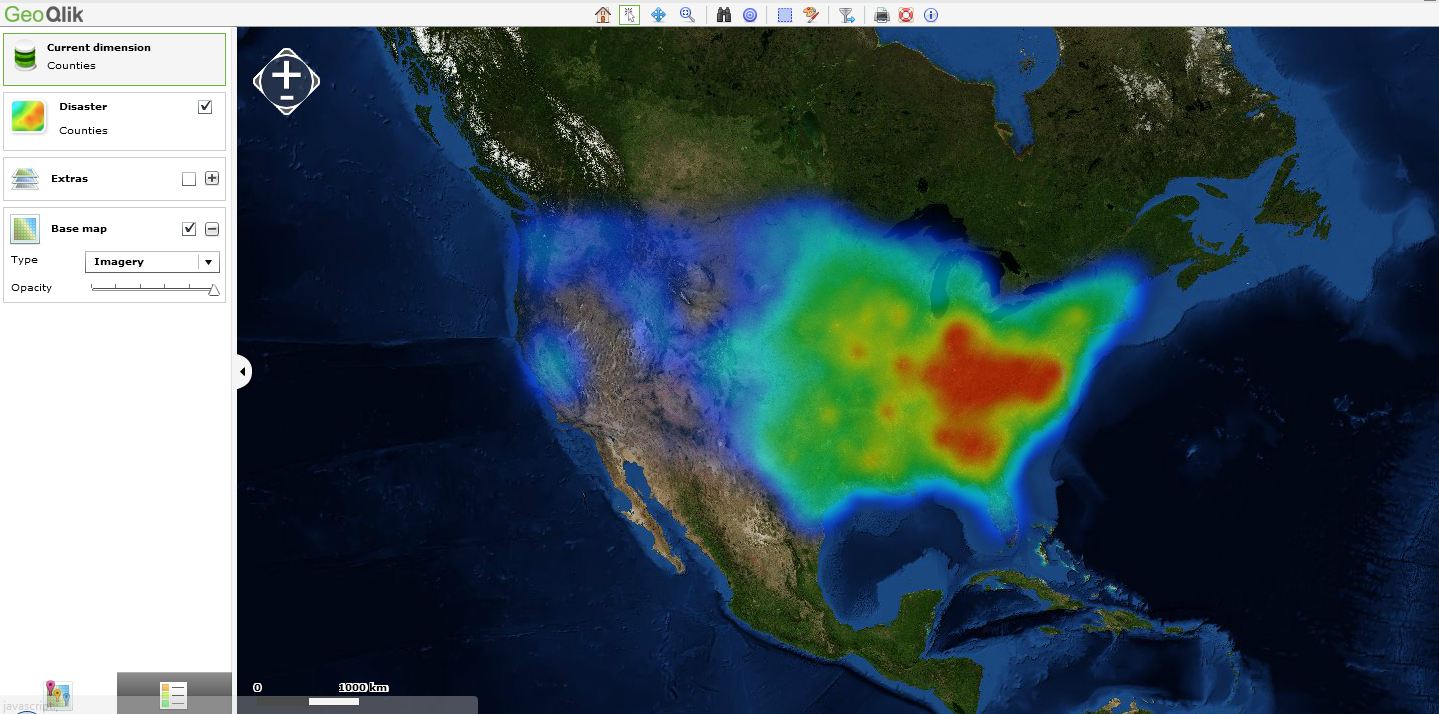
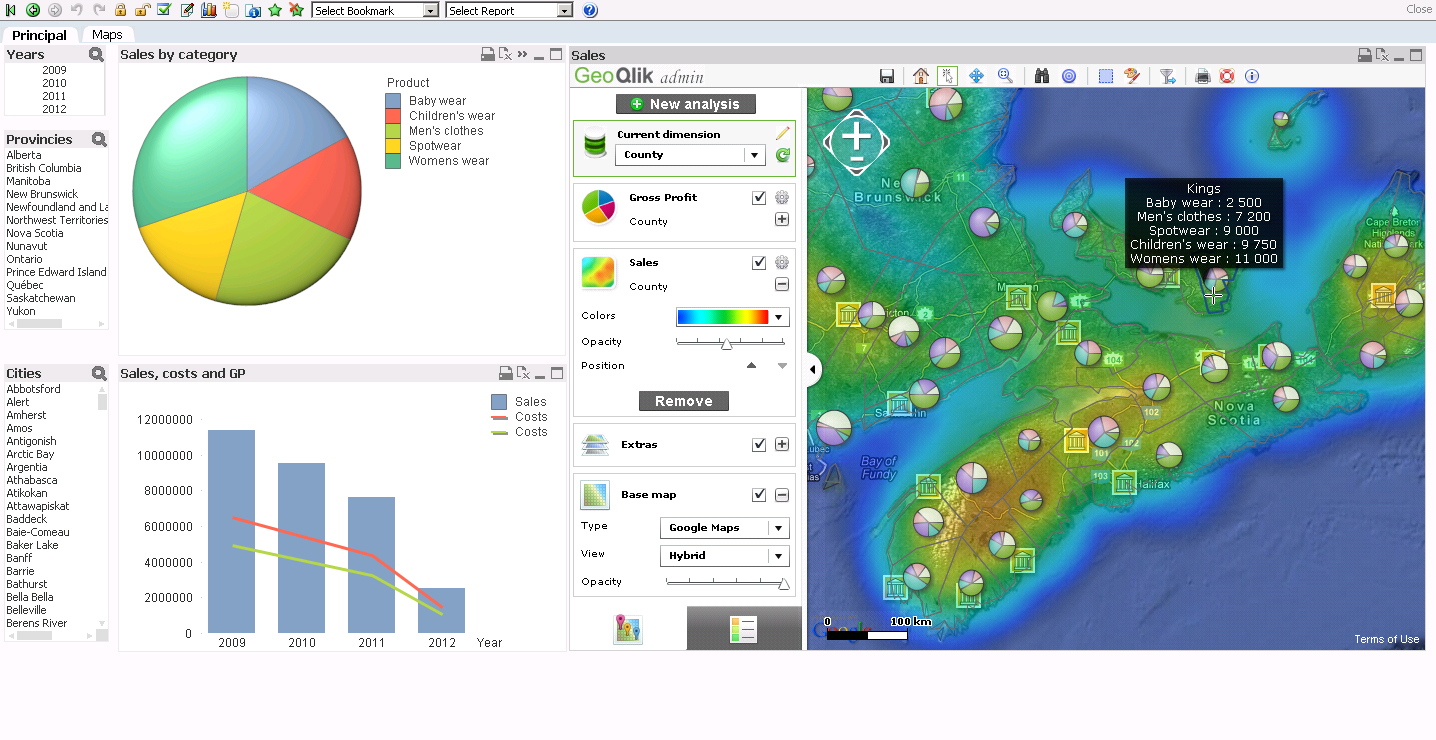
GIS/Maps Analytics in QlikView is a very interesting topic and "Heat Maps" are one of the ways to display QlikVIew KPI indicators and to represent a density on a Geografic map (ex: population, deliveries, etc.)
QlikView customers and channel parners are interested in displaying their QlikView KPI indicators on Geographic maps but also sometimes on a building plan (ex: logistic warehouse, supermarket, hospital, etc).
Business Geografic has developed a mapping extension for QlikView (V9, V10, V11) namely "GeoQlik" and we have been a Technology Partner of QlikTech since 2006 starting with QlikView 8!
I hereby suggest you to have a look at our new mapping extension for QlikView 11 "SR1": GeoQlik v11.6:
http://www.geoqlik.com/en/geoqlik-for-qlikview/geoqlik-v11.html
Please find hereafter a few "Heat Maps" screenshots of GeoQlik V11.6 using WMS/TMS services to display QlikView KPIs:
Thanks and best regards,
David
@ Business Geografic