Unlock a world of possibilities! Login now and discover the exclusive benefits awaiting you.
- Qlik Community
- :
- All Forums
- :
- QlikView App Dev
- :
- Identifying Top % of users and Top % of Spenting
- Subscribe to RSS Feed
- Mark Topic as New
- Mark Topic as Read
- Float this Topic for Current User
- Bookmark
- Subscribe
- Mute
- Printer Friendly Page
- Mark as New
- Bookmark
- Subscribe
- Mute
- Subscribe to RSS Feed
- Permalink
- Report Inappropriate Content
Identifying Top % of users and Top % of Spenting
Greetings 
Need your help with the following. Please refer to the attached data.
| USER_ID MODEL YYYYMM AVG_TOTAL_SPENT AVG_ONLINE_SPENT AVG_OFFLINE_SPENT AVG_REWARDS |
AVG_TOTAL_SPENT is monthly average which is derived using some internal algorithm which averages based on past month.
So AVG_TOTAL_SPENT may not be the sum of AVG_OFFLINE and AVG_ONLINE.
The data is on Monthly Basis. ie YYYYMM. It is 5 months of revenue for a small firm. Revenue grows over period of 5 months. so all users not necessarily spending every month but majority does revisit regularly.
I want to find the following
Phase 1(Across 5 months)
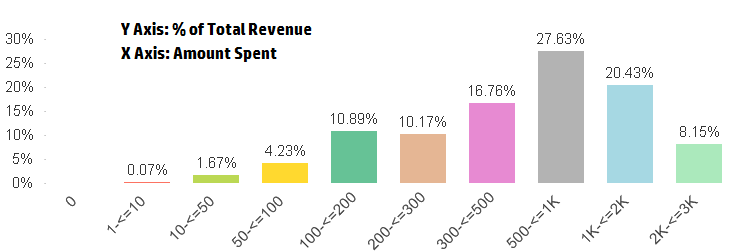
1. Identify VIP Customers: Top 20% of Users and their total avg_total_spenting in %
Example: Top 20% of users (1000 users) contribute to 70% of revenue ( 3.2 Million)
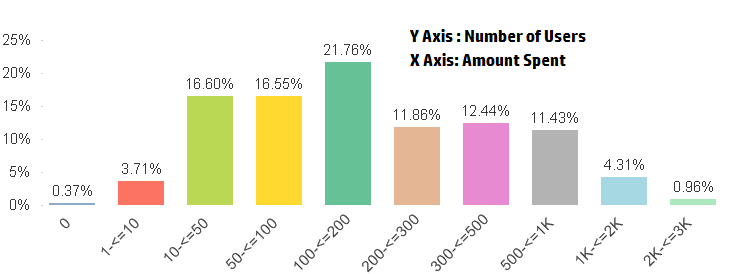
2. Identify revenue: % users and their contribution in revenue
Example: Top 70% of users(14000 users) contribute to 90% of revenue (4.0 million)
Phase II(Monthly basis)
3. How do I distribute the above on monthly basis?
I am using some complicated method to find as below. Then I select this users manually and find total revenue and % of users.WHich is not a right way.
Thank you for your expert advise.
- Mark as New
- Bookmark
- Subscribe
- Mute
- Subscribe to RSS Feed
- Permalink
- Report Inappropriate Content
Have a look at the dimension limits tab. This can show you the Top N % based on the first expression.
- Mark as New
- Bookmark
- Subscribe
- Mute
- Subscribe to RSS Feed
- Permalink
- Report Inappropriate Content
I have updated my original postings with charts. Is their any simplified method like RANK function, FIRSTSORTEDVALUE function?
- Mark as New
- Bookmark
- Subscribe
- Mute
- Subscribe to RSS Feed
- Permalink
- Report Inappropriate Content