Unlock a world of possibilities! Login now and discover the exclusive benefits awaiting you.
- Qlik Community
- :
- All Forums
- :
- QlikView App Dev
- :
- How to set legends in bar charts
Options
- Subscribe to RSS Feed
- Mark Topic as New
- Mark Topic as Read
- Float this Topic for Current User
- Bookmark
- Subscribe
- Mute
- Printer Friendly Page
Turn on suggestions
Auto-suggest helps you quickly narrow down your search results by suggesting possible matches as you type.
Showing results for
MVP
2013-06-14
05:19 AM
- Mark as New
- Bookmark
- Subscribe
- Mute
- Subscribe to RSS Feed
- Permalink
- Report Inappropriate Content
How to set legends in bar charts
Hii,
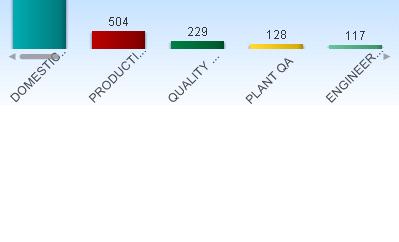
I am having bar graph with depts as dimensions but this are not fitting my graph , Manual setting SHIFT+CTRL
I have done but still I am not getting proper labels of legends even I set font size and size to display.
Any one have Idea how to achive the same.
Thanks
Vikas
Hope this resolve your issue.
If the issue is solved please mark the answer with Accept as Solution & like it.
If you want to go quickly, go alone. If you want to go far, go together.
If the issue is solved please mark the answer with Accept as Solution & like it.
If you want to go quickly, go alone. If you want to go far, go together.
474 Views
3 Replies
Master II
2013-06-14
05:24 AM
- Mark as New
- Bookmark
- Subscribe
- Mute
- Subscribe to RSS Feed
- Permalink
- Report Inappropriate Content
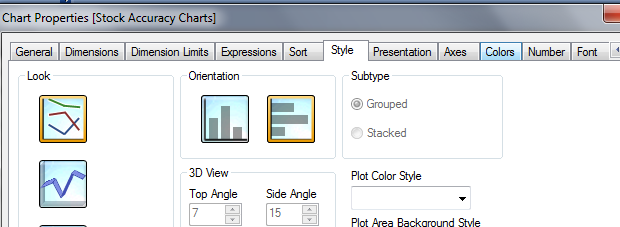
If your labels are long text you could minimize, by going to the Presentation Tab and tick the box limit legend
or
Change the Orientation of the Chart, if the labels are important
210 Views
MVP
2013-06-14
05:25 AM
- Mark as New
- Bookmark
- Subscribe
- Mute
- Subscribe to RSS Feed
- Permalink
- Report Inappropriate Content
Axes - >Dimension Axes -> Font
Did you try this?
Thanks.
210 Views
Master III
2013-06-14
05:25 AM
- Mark as New
- Bookmark
- Subscribe
- Mute
- Subscribe to RSS Feed
- Permalink
- Report Inappropriate Content
Go to presentation tab and there to legend setting explore there .hope it resolves your problem
210 Views