Unlock a world of possibilities! Login now and discover the exclusive benefits awaiting you.
- Qlik Community
- :
- All Forums
- :
- QlikView App Dev
- :
- How to hava a description from an expression value...
- Subscribe to RSS Feed
- Mark Topic as New
- Mark Topic as Read
- Float this Topic for Current User
- Bookmark
- Subscribe
- Mute
- Printer Friendly Page
- Mark as New
- Bookmark
- Subscribe
- Mute
- Subscribe to RSS Feed
- Permalink
- Report Inappropriate Content
How to hava a description from an expression value ??
Hi,
I need some help here.
I do have a expresion thar sum some field and It returns me a number.
What I need to do is that depending of that number I have to selec a description from another table like this
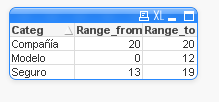
then, is the Expression is from 0 to 12 this column shows MODELO, if the expression is between 13 and 19 the column shows SEGURO and if it is more than 19 it shows COMPANIA.
This table i am showing is dynamic, so the numbers will change eventually.
Any help??
- Tags:
- between
- expression(+)
- Mark as New
- Bookmark
- Subscribe
- Mute
- Subscribe to RSS Feed
- Permalink
- Report Inappropriate Content
The IntervalMatch prefix for the Load statement (in a load script) is specifically made to help you with such a scenario. It will create the link-table between the actual numbers and which interval they belong to.
Look in QlikView Help and search for IntervalMatch and you will find examples.
- Mark as New
- Bookmark
- Subscribe
- Mute
- Subscribe to RSS Feed
- Permalink
- Report Inappropriate Content
Can you post a Qlikview document that demonstrates the problem?
talk is cheap, supply exceeds demand
- Mark as New
- Bookmark
- Subscribe
- Mute
- Subscribe to RSS Feed
- Permalink
- Report Inappropriate Content
I understand but the number i have to link with the interval is the sum of two diferents field from two diferents tables.e 1
Like this:
table_score:
======
User
Date
Point
table_XtraScores:
==============
User
Date
ExtraPoints
I do have to sum(Point)+sum(ExtraPoints)
And this result will have to make the relation with the Intervals Table.
- Mark as New
- Bookmark
- Subscribe
- Mute
- Subscribe to RSS Feed
- Permalink
- Report Inappropriate Content
You can have an expression that will match your interval by a calculated number by using a set expression with search:
=Concat( { <Range_from={"<=$(=N)"} ,Range_to={">=$(=N)"}>} Categ,',')
N has to be replace by your sum:
=Concat( { <Start={"<=$(=(sum(Point)+sum(ExtraPoints) ))"} ,End={">=$(=(sum(Point)+sum(ExtraPoints)))"}>} Desc,',')
If you label your sums column with N you could possibly keep the first expression...
The concat will actually give a list of categories - separated by commas - if they for some reason overlap and the sums fall into both ranges.
- Mark as New
- Bookmark
- Subscribe
- Mute
- Subscribe to RSS Feed
- Permalink
- Report Inappropriate Content
Yes, a sample QVW would make things more easy to understand.
Maybe you can use advanced aggregation to iterate over Category and compare your expression result to lower and upper limit, something like
=only( aggr( if(YourExpr >= Range_From and YourExpr <= Range_To, Category), Category))
- Mark as New
- Bookmark
- Subscribe
- Mute
- Subscribe to RSS Feed
- Permalink
- Report Inappropriate Content
You might need to add your chart dimensions to the advanced aggregation dimensions when using in a chart.
There might be alternatives using FieldValue() or only() with set analysis. See attached for some sample applications.