Unlock a world of possibilities! Login now and discover the exclusive benefits awaiting you.
- Qlik Community
- :
- All Forums
- :
- QlikView App Dev
- :
- How to get the 3 months and 6 months bucket from Y...
- Subscribe to RSS Feed
- Mark Topic as New
- Mark Topic as Read
- Float this Topic for Current User
- Bookmark
- Subscribe
- Mute
- Printer Friendly Page
- Mark as New
- Bookmark
- Subscribe
- Mute
- Subscribe to RSS Feed
- Permalink
- Report Inappropriate Content
How to get the 3 months and 6 months bucket from Year field
I have year and Amount
Year Amount
2020 10000
2019 20000
2201 30000
2017 20000
2016 60000
2015 10000
2014 20000
2013 40000
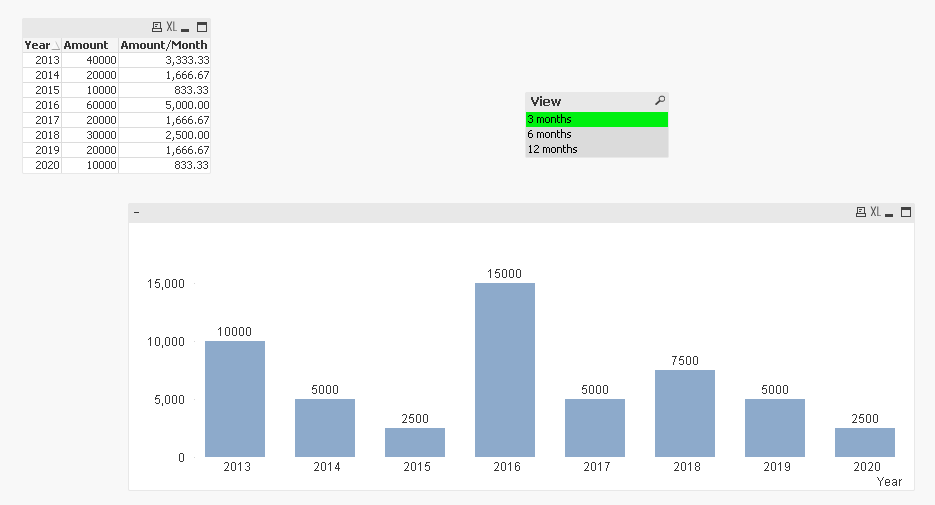
I want to get the sum of amount for 12 month ,6 Months and 3 months in a bar chart for the current year
How can I do this ?
Accepted Solutions
- Mark as New
- Bookmark
- Subscribe
- Mute
- Subscribe to RSS Feed
- Permalink
- Report Inappropriate Content
May be this:
Table:
LOAD Year,
Amount,
Amount/12 as [Amount/Month];
LOAD * Inline [
Year, Amount
2020, 10000
2019, 20000
2018, 30000
2017, 20000
2016, 60000
2015, 10000
2014, 20000
2013, 40000
];
View:
LOAD * Inline [
View, No
3 months, 3
6 months, 6
12 months, 12
];
- Mark as New
- Bookmark
- Subscribe
- Mute
- Subscribe to RSS Feed
- Permalink
- Report Inappropriate Content
I don't see how Year alone can help you derive Month. Is there a linear relation here?
for instance for 2020, we have 10,000 for the year/12 months = 833.33/month?
- Mark as New
- Bookmark
- Subscribe
- Mute
- Subscribe to RSS Feed
- Permalink
- Report Inappropriate Content
Yes.Thank you.
- Mark as New
- Bookmark
- Subscribe
- Mute
- Subscribe to RSS Feed
- Permalink
- Report Inappropriate Content
May be this:
Table:
LOAD Year,
Amount,
Amount/12 as [Amount/Month];
LOAD * Inline [
Year, Amount
2020, 10000
2019, 20000
2018, 30000
2017, 20000
2016, 60000
2015, 10000
2014, 20000
2013, 40000
];
View:
LOAD * Inline [
View, No
3 months, 3
6 months, 6
12 months, 12
];