Unlock a world of possibilities! Login now and discover the exclusive benefits awaiting you.
- Qlik Community
- :
- All Forums
- :
- QlikView App Dev
- :
- How to get movement plot?
Options
- Subscribe to RSS Feed
- Mark Topic as New
- Mark Topic as Read
- Float this Topic for Current User
- Bookmark
- Subscribe
- Mute
- Printer Friendly Page
Turn on suggestions
Auto-suggest helps you quickly narrow down your search results by suggesting possible matches as you type.
Showing results for
Not applicable
2017-07-27
01:58 AM
- Mark as New
- Bookmark
- Subscribe
- Mute
- Subscribe to RSS Feed
- Permalink
- Report Inappropriate Content
How to get movement plot?
Hi all,
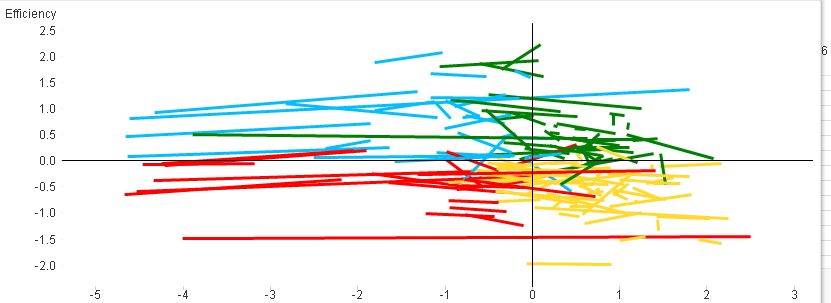
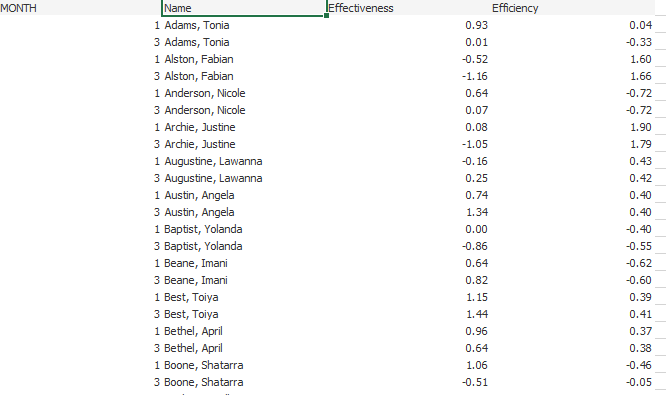
I have a requirement for which i need to make a movement plot. In this graph, the line would show the movement of the values from one month to the other. (Sample plot is attached in the email)
I tried replicating it in Qlikview, i have shared my progress with you, I have the below blocking points:
1. the tool tip is not visible when we hover over the graph
2. How do we achieve the change in colour from one quadrant to the other
I have attached the sample qlik file, please have a look.
- Tags:
- movementplot
- qlikview
238 Views
0 Replies