Unlock a world of possibilities! Login now and discover the exclusive benefits awaiting you.
- Qlik Community
- :
- All Forums
- :
- QlikView App Dev
- :
- How to display an event timeline
- Subscribe to RSS Feed
- Mark Topic as New
- Mark Topic as Read
- Float this Topic for Current User
- Bookmark
- Subscribe
- Mute
- Printer Friendly Page
- Mark as New
- Bookmark
- Subscribe
- Mute
- Subscribe to RSS Feed
- Permalink
- Report Inappropriate Content
How to display an event timeline
Within a much larger application, I have created a concatenated table of various events so I can summarize the time sequence:
The table has these fields:
Person,
EventTime,
EventDesc
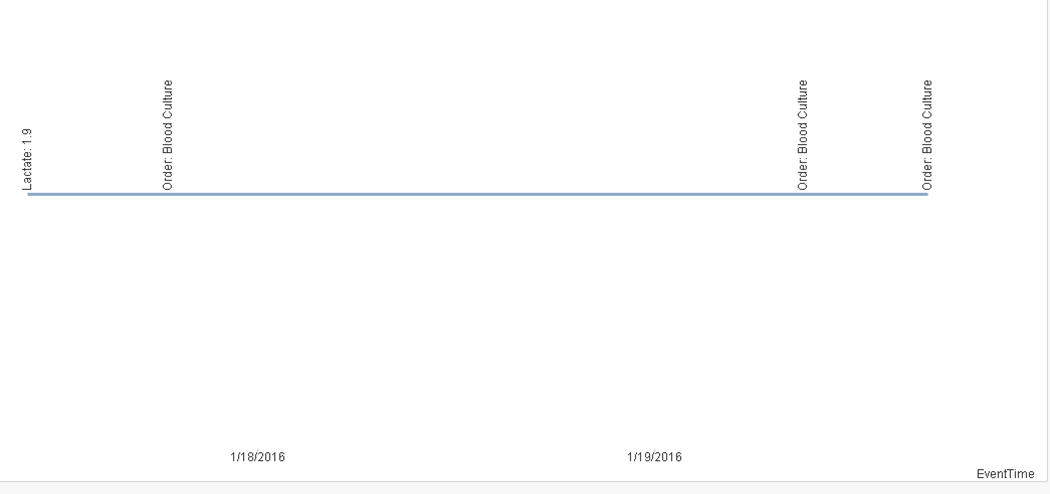
My goal is to display, for each Person, a timeline with the events labeled.
I am very close to what I want by having a dimension of EventTime and a dual expression =Dual(EventDesc,EventTime), then plotting the dimension continuously on a line graph and displaying the expression vertically. I would prefer points, not a line and I would like the Y-axis to be Person so I can display multiple timelines at once. Right now, there is a y-axis that I think is the integer value of EventTime