Unlock a world of possibilities! Login now and discover the exclusive benefits awaiting you.
- Qlik Community
- :
- All Forums
- :
- QlikView App Dev
- :
- Re: How to create interval of time values in a cha...
- Subscribe to RSS Feed
- Mark Topic as New
- Mark Topic as Read
- Float this Topic for Current User
- Bookmark
- Subscribe
- Mute
- Printer Friendly Page
- Mark as New
- Bookmark
- Subscribe
- Mute
- Subscribe to RSS Feed
- Permalink
- Report Inappropriate Content
How to create interval of time values in a chart
Hello Qlikview wizards,
I have a question about creating a Time interval in a chart.
On my main axe there are multiple time values (hh:mm:ss), I want to narrow the values down to get a cleaner overview.
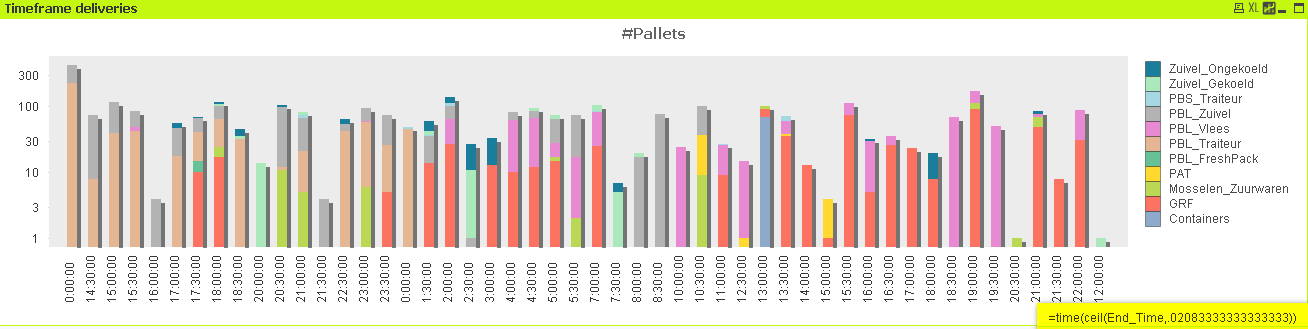
I want the Nbr of pallets shown per half hour instead of each time value I have in my data..
Does anyone know how to do this please? I've attached a simple example.
Kind regards,
Ambertje
- Tags:
- new_to_qlikview
- « Previous Replies
-
- 1
- 2
- Next Replies »
Accepted Solutions
- Mark as New
- Bookmark
- Subscribe
- Mute
- Subscribe to RSS Feed
- Permalink
- Report Inappropriate Content
PLEASE FIND ATTACHED.. I have created bucket based on your requirement i.e half an hour segmentation. Please let me know if its helpful
- Mark as New
- Bookmark
- Subscribe
- Mute
- Subscribe to RSS Feed
- Permalink
- Report Inappropriate Content
PLEASE FIND ATTACHED.. I have created bucket based on your requirement i.e half an hour segmentation. Please let me know if its helpful
- Mark as New
- Bookmark
- Subscribe
- Mute
- Subscribe to RSS Feed
- Permalink
- Report Inappropriate Content
maybe just changing the dimension to '=time(ceil(End_Time,.02083333333333333))'
- Mark as New
- Bookmark
- Subscribe
- Mute
- Subscribe to RSS Feed
- Permalink
- Report Inappropriate Content
It is helpfull but I would like the Aisles presented next to each other instead of stacked.
Could you also tell me what the bucket does and how the function works?
Later on I might want to change the interval to hours or quarter hours.
Thanks for your help 
- Mark as New
- Bookmark
- Subscribe
- Mute
- Subscribe to RSS Feed
- Permalink
- Report Inappropriate Content
- on graph propriety / style / you can choose 'stacked' or s'eparate'
-to display every hour, replace 0.020833333343035 by 60/1440=0.0416666666
-to display every quarter hours (15 mn), replace 0.020833333343035 by 15/1440 = 0.0104166666666
indeed, 1440 = amount of minuts in one day (24*60)
to display every X mn, you have to round your dimension by an offset of X/1440
0.0208333333 = 30/1440 and so display every half an hour
- Mark as New
- Bookmark
- Subscribe
- Mute
- Subscribe to RSS Feed
- Permalink
- Report Inappropriate Content
for an easier choice of your display, you can use a variable in the expression
=time(subfield(class(num(End_Time),$(v1)/1440,'ENDTIME'),' ',1))&'-'&time(subfield(class(num(End_Time),$(v1)/1440,'END TIME'),' ',6))
and manually enter the variable
- Mark as New
- Bookmark
- Subscribe
- Mute
- Subscribe to RSS Feed
- Permalink
- Report Inappropriate Content
Wahoo...clever !
- Mark as New
- Bookmark
- Subscribe
- Mute
- Subscribe to RSS Feed
- Permalink
- Report Inappropriate Content
Bucket groups your data with a uniform segmentation.... If you wan to change the interval, change 0.020833333343035 to what interval you need...
BTW 0.020833333343035 is a result of num(time#('00:30:00','hh:mm:ss')) .. if you wan to change the iterval just change the '00:30:00' part and attain the numeric value of your time to use it in the CLASS function
- Mark as New
- Bookmark
- Subscribe
- Mute
- Subscribe to RSS Feed
- Permalink
- Report Inappropriate Content
It's working great, you guys are throughly amazing.
Thanks a million.
Someday I will like working with qlikview charts thanks to you all. 
- Mark as New
- Bookmark
- Subscribe
- Mute
- Subscribe to RSS Feed
- Permalink
- Report Inappropriate Content
Hi,
Read this article written by Henric about creating Bucket.
http://community.qlik.com/blogs/qlikviewdesignblog/2014/07/14/buckets
It will help you regarding your requirement.
Regards
Please appreciate our Qlik community members by giving Kudos for sharing their time for your query. If your query is answered, please mark the topic as resolved 🙂
- « Previous Replies
-
- 1
- 2
- Next Replies »