Unlock a world of possibilities! Login now and discover the exclusive benefits awaiting you.
- Qlik Community
- :
- All Forums
- :
- QlikView App Dev
- :
- How to Move Expression lables from Plot area
- Subscribe to RSS Feed
- Mark Topic as New
- Mark Topic as Read
- Float this Topic for Current User
- Bookmark
- Subscribe
- Mute
- Printer Friendly Page
- Mark as New
- Bookmark
- Subscribe
- Mute
- Subscribe to RSS Feed
- Permalink
- Report Inappropriate Content
How to Move Expression lables from Plot area
Hi Friends,
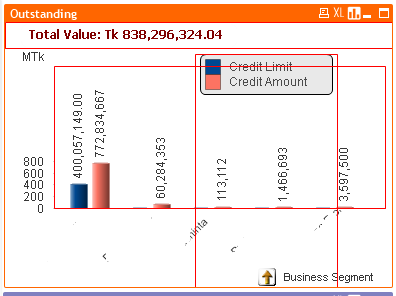
Attached is the report I am developed.
Accuracy By Qty and Accuracy by Cost are the two expressions. but both expression labels are showing in plot area.
I don't want to show that expression labels in plot area.
it have to display outside of the plot area.
Can any one help me with this
Thank you,
Satya Paleti
- Tags:
- new_to_qlikview
- Mark as New
- Bookmark
- Subscribe
- Mute
- Subscribe to RSS Feed
- Permalink
- Report Inappropriate Content
While the chart is active, press Ctrl +Shift and you will see red lines. Drag the legend red lines to the place you want to put them.
HTH
Best,
Sunny
- Mark as New
- Bookmark
- Subscribe
- Mute
- Subscribe to RSS Feed
- Permalink
- Report Inappropriate Content
Hi
Press Ctrl+Shift Button and with the help of arrow key you can adjust the lables of the expressions wherever you
want to move.
Hope this help you
Thanks&Regards
Amar
- Mark as New
- Bookmark
- Subscribe
- Mute
- Subscribe to RSS Feed
- Permalink
- Report Inappropriate Content
The legend has been manually positioned there using the method described above. You can reset the manual positioning by clicking "Reset User Sizing" and "Reset User Docking" on the chart Properties | General tab. The default positioning places the legend outside the plot area.
- Mark as New
- Bookmark
- Subscribe
- Mute
- Subscribe to RSS Feed
- Permalink
- Report Inappropriate Content
First you select your chart then press CTRL+SHIFT button and drag and drop as your favorite place