Unlock a world of possibilities! Login now and discover the exclusive benefits awaiting you.
- Qlik Community
- :
- All Forums
- :
- QlikView App Dev
- :
- How can i make a table with week range
- Subscribe to RSS Feed
- Mark Topic as New
- Mark Topic as Read
- Float this Topic for Current User
- Bookmark
- Subscribe
- Mute
- Printer Friendly Page
- Mark as New
- Bookmark
- Subscribe
- Mute
- Subscribe to RSS Feed
- Permalink
- Report Inappropriate Content
How can i make a table with week range
Hi community,
I want to make a table like this but i dont knwo what expression i can make
Week Sales
31-41 100M
32-41 90M
33-41 65M
Can anyone tell me how to do it
- Mark as New
- Bookmark
- Subscribe
- Mute
- Subscribe to RSS Feed
- Permalink
- Report Inappropriate Content
And also i have a range of week 27-45
How can i set the range be 31-41?
- Mark as New
- Bookmark
- Subscribe
- Mute
- Subscribe to RSS Feed
- Permalink
- Report Inappropriate Content
Could you provide a sample input data and expected output against that?
- Mark as New
- Bookmark
- Subscribe
- Mute
- Subscribe to RSS Feed
- Permalink
- Report Inappropriate Content
I have the following expression now
Dimension:class(Floor(Week),1)
Measurement:Sum(DISTINCT {<Week = {">=$(=31)<$(=41)"} >} LineTotalSales )
The outcome is: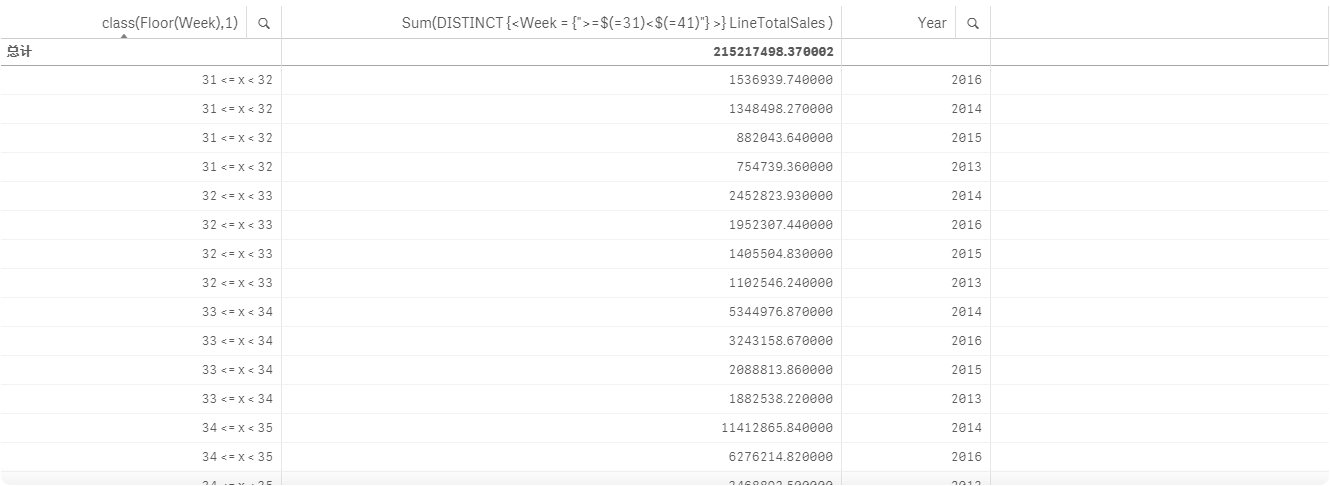
- Mark as New
- Bookmark
- Subscribe
- Mute
- Subscribe to RSS Feed
- Permalink
- Report Inappropriate Content
But i WANT
31<X<41
32<X<41
33<X<41
34<X<41
what should i modify in order to get the dimension likes this
- Mark as New
- Bookmark
- Subscribe
- Mute
- Subscribe to RSS Feed
- Permalink
- Report Inappropriate Content
For these uneven intervals class() alone might not be enough here. I guess you might have to take some help from the-as-of-table concept or, a little complex and not-so-nice solution using synthetic dimension. Try to share your sample raw data (in excel may be).