Unlock a world of possibilities! Login now and discover the exclusive benefits awaiting you.
- Qlik Community
- :
- All Forums
- :
- QlikView App Dev
- :
- Hi..Can someone help me out with this.... I have g...
Options
- Subscribe to RSS Feed
- Mark Topic as New
- Mark Topic as Read
- Float this Topic for Current User
- Bookmark
- Subscribe
- Mute
- Printer Friendly Page
Turn on suggestions
Auto-suggest helps you quickly narrow down your search results by suggesting possible matches as you type.
Showing results for
Creator III
2017-11-08
02:01 PM
- Mark as New
- Bookmark
- Subscribe
- Mute
- Subscribe to RSS Feed
- Permalink
- Report Inappropriate Content
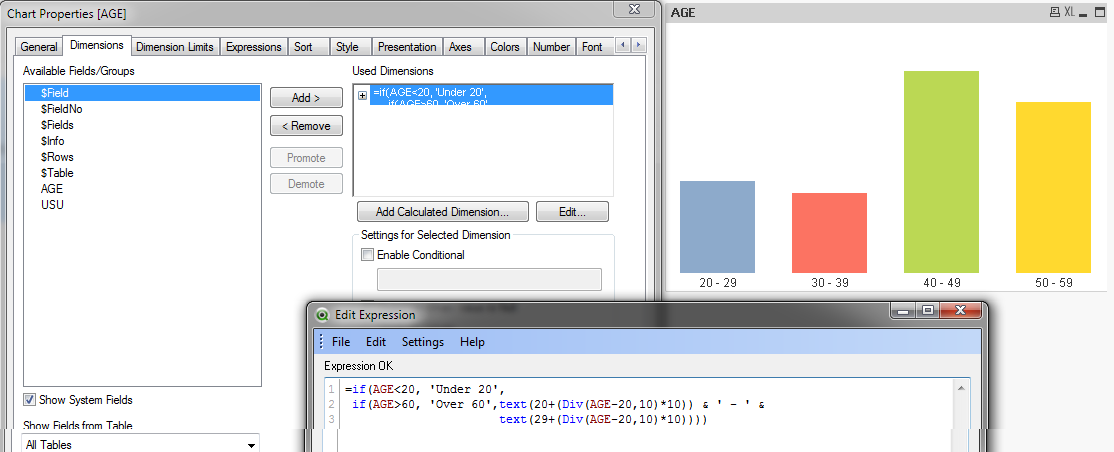
Hi..Can someone help me out with this.... I have got a Table as mentioned below. I want to display the count (number of employees) between age group 20-29,30-39,40-49,50-60 in a bar chart where 20-29,30-39,40-49 should be x axis ?
| EmployeeId | EmployeeName | Age |
|---|---|---|
Thanks in Advance 
506 Views
1 Solution
Accepted Solutions
Creator III
2017-11-09
06:38 AM
Author
- Mark as New
- Bookmark
- Subscribe
- Mute
- Subscribe to RSS Feed
- Permalink
- Report Inappropriate Content
Thank You Sir.It was so much helpful
392 Views
5 Replies
Specialist
2017-11-08
03:44 PM
- Mark as New
- Bookmark
- Subscribe
- Mute
- Subscribe to RSS Feed
- Permalink
- Report Inappropriate Content
Hi Baarathi
OPTION-1 : =Class(AGE,10)
OPTION-2 :
=if(AGE<20, 'Under 20',
if(AGE>60, 'Over 60',text(20+(Div(AGE-20,10)*10)) & ' - ' &
text(29+(Div(AGE-20,10)*10))))
MVP
2017-11-08
05:45 PM
- Mark as New
- Bookmark
- Subscribe
- Mute
- Subscribe to RSS Feed
- Permalink
- Report Inappropriate Content
Creator III
2017-11-09
06:38 AM
Author
- Mark as New
- Bookmark
- Subscribe
- Mute
- Subscribe to RSS Feed
- Permalink
- Report Inappropriate Content
Thank You Sir.It was so much helpful
393 Views
Creator III
2017-11-09
06:41 AM
Author
- Mark as New
- Bookmark
- Subscribe
- Mute
- Subscribe to RSS Feed
- Permalink
- Report Inappropriate Content
Thank you, sir
Creator III
2017-11-09
07:23 AM
Author
- Mark as New
- Bookmark
- Subscribe
- Mute
- Subscribe to RSS Feed
- Permalink
- Report Inappropriate Content
Can you please explain me about how this section of your statement works?
text(20+(Div(AGE-20,10)*10)) & ' - ' &
text(29+(Div(AGE-20,10)*10))))
392 Views