Unlock a world of possibilities! Login now and discover the exclusive benefits awaiting you.
- Qlik Community
- :
- All Forums
- :
- QlikView App Dev
- :
- Help with a product mix forecast
- Subscribe to RSS Feed
- Mark Topic as New
- Mark Topic as Read
- Float this Topic for Current User
- Bookmark
- Subscribe
- Mute
- Printer Friendly Page
- Mark as New
- Bookmark
- Subscribe
- Mute
- Subscribe to RSS Feed
- Permalink
- Report Inappropriate Content
Help with a product mix forecast
I have attached a sample data set that is representative of a MUCH larger data set.
We received forecasts at a customer level for the upcoming year, I would then like to apply those forecasted changes to the actual sales in FY2014 resulting in an FY2015 Projection (this has been done manually in the table CompleteDataSet). Also where we did not receive a forecast (two of the customers) we would like to replace the null with a standard value (13% was manually entered in the table CompleteDataSet).
The output goal would be a product mix for each branch/channel.
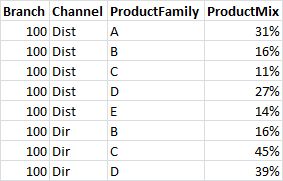
The final result for Branch 100 Channel Dist should be:
A: 31%
B: 16%
C: 11%
😧 27%
E: 14%
- Tags:
- new_to_qlikview
Accepted Solutions
- Mark as New
- Bookmark
- Subscribe
- Mute
- Subscribe to RSS Feed
- Permalink
- Report Inappropriate Content
Something like attached?
- Mark as New
- Bookmark
- Subscribe
- Mute
- Subscribe to RSS Feed
- Permalink
- Report Inappropriate Content
You can do it like this:
SampleDataSet:
LOAD *,
ForecastedChange * FY2014+FY2014 as FY2015_Projection;
LOAD Branch, Channel, ProductFamily, FY2014,
if(len(trim(ForecastedChange)),ForecastedChange,0.13) as ForecastedChange;
LOAD * INLINE [
Branch, Channel, Customer, ProductFamily, FY2014, ForecastedChange
100, Dist, 7871, A, 927, 0.11
....
];
- Mark as New
- Bookmark
- Subscribe
- Mute
- Subscribe to RSS Feed
- Permalink
- Report Inappropriate Content
Please see the attached.
- Mark as New
- Bookmark
- Subscribe
- Mute
- Subscribe to RSS Feed
- Permalink
- Report Inappropriate Content
Thank you both (you both had essentially the same suggestion). However, I'm still in need of the second part. I need to be able to generate a chart that looks similar to the image below.
- Mark as New
- Bookmark
- Subscribe
- Mute
- Subscribe to RSS Feed
- Permalink
- Report Inappropriate Content
Something like attached?
- Mark as New
- Bookmark
- Subscribe
- Mute
- Subscribe to RSS Feed
- Permalink
- Report Inappropriate Content
Exactly.
It was the " sum(total<Branch,Channel> FY2015_Projection) that I couldn't figure out.
Thank you!