Unlock a world of possibilities! Login now and discover the exclusive benefits awaiting you.
- Qlik Community
- :
- All Forums
- :
- QlikView App Dev
- :
- Help for create Scatter or Grid chart
- Subscribe to RSS Feed
- Mark Topic as New
- Mark Topic as Read
- Float this Topic for Current User
- Bookmark
- Subscribe
- Mute
- Printer Friendly Page
- Mark as New
- Bookmark
- Subscribe
- Mute
- Subscribe to RSS Feed
- Permalink
- Report Inappropriate Content
Help for create Scatter or Grid chart
Hi all
I have a table like this:
| Brand | Sale | Space |
|---|---|---|
| A01 | 100 | 5 |
| B15 | 120 | 2 |
| F36 | 110 | 3 |
| A01 | 200 | 4 |
| P12 | 170 | 7 |
| F36 | 140 | 2 |
I want to show this information on a Scatter or Grid chart with this parameters:
Axes:
X = Brand
Y = Total Sale
Size of Bubble = Total Space
Could you please help me to create this chart.
Thanks in advance.
Regards,
Ashkan
- Tags:
- new_to_qlikview
- Mark as New
- Bookmark
- Subscribe
- Mute
- Subscribe to RSS Feed
- Permalink
- Report Inappropriate Content
Hi Ashkan,
Are you facing any specific issue?
I have attached file which have simple Grid Chart.
Please explain detailed
- Mark as New
- Bookmark
- Subscribe
- Mute
- Subscribe to RSS Feed
- Permalink
- Report Inappropriate Content
Hi karthiks
Thanks for your reply.
I have edited my table in first post.
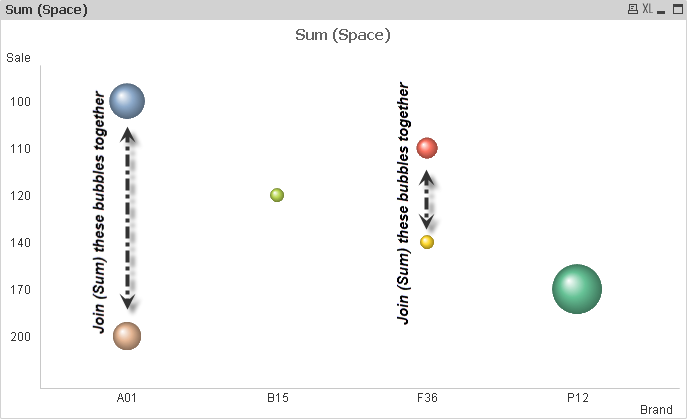
I created a grid chart like this:
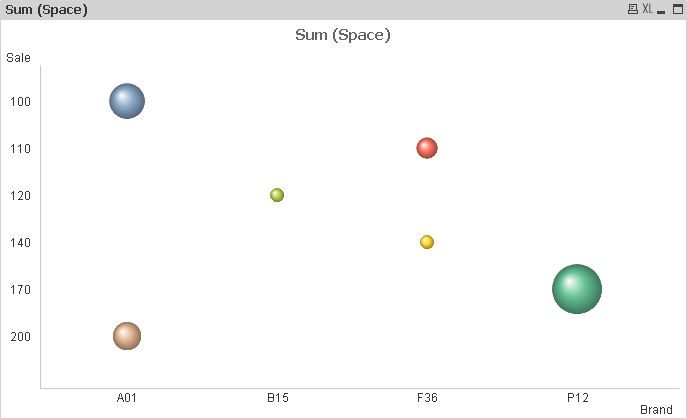
But I want every brand has one bubble (Occupied sapce by every brand).
I wish I could explain what I want.
- Mark as New
- Bookmark
- Subscribe
- Mute
- Subscribe to RSS Feed
- Permalink
- Report Inappropriate Content
Use a calculated dimension =aggr(sum(Sale),Brand) instead of Sale. See attached qvw
talk is cheap, supply exceeds demand
- Mark as New
- Bookmark
- Subscribe
- Mute
- Subscribe to RSS Feed
- Permalink
- Report Inappropriate Content
Hi Gysbert
Unfortunately I can't open this attachment, because I'm using Personal Edition.
Could you please write the scrip or explain what you did.
Thank you in avdance.