Unlock a world of possibilities! Login now and discover the exclusive benefits awaiting you.
- Qlik Community
- :
- All Forums
- :
- QlikView App Dev
- :
- Handling facts with a date range. Create a day tab...
- Subscribe to RSS Feed
- Mark Topic as New
- Mark Topic as Read
- Float this Topic for Current User
- Bookmark
- Subscribe
- Mute
- Printer Friendly Page
- Mark as New
- Bookmark
- Subscribe
- Mute
- Subscribe to RSS Feed
- Permalink
- Report Inappropriate Content
Handling facts with a date range. Create a day table or use set analysis?
Hi Qlik Gurus,
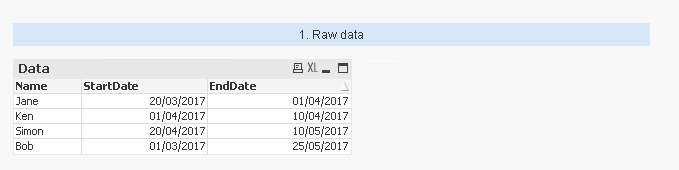
I have a scenario where the Fact in my data is a Booking. Each Booking has a Start Date and an End Date.
I need to produce reports to show how many Bookings are active at a point in time (eg. on a day, or on a month).
I have initially approached this scenario by creating a "Day" table in the Load Script. By this I mean that the original fact table is expanded out so that each line represents one date for the booking. This works well, however it results in a very large dataset in my actual scenario.
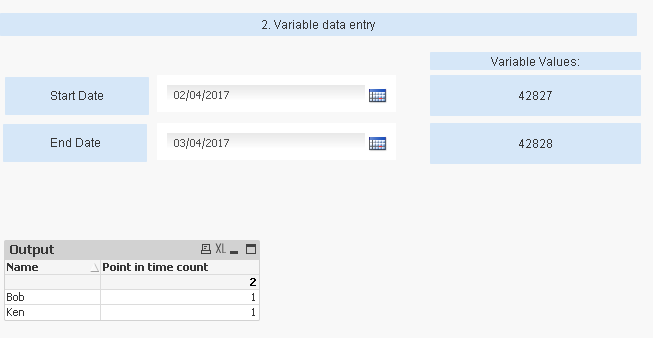
I am considering an alternate solution (attached in QVW). In this solution, I have a start date and an end date assigned to variables.
I then use Set Analysis to count the number of Bookings between my Start and End selection variables (below). This works well.
count(
{<
StartDate = {"<=$(vSelectionDateEnd)"},
EndDate = {">=$(vSelectionDateStart)"}
>}
Name
)
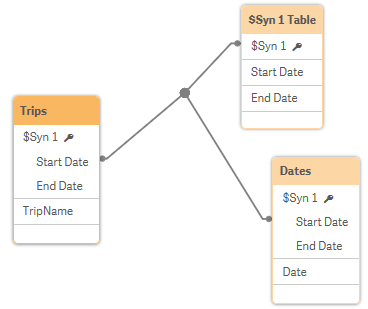
However, now I would like to create a line chart how many bookings were active by month. Usually this would be easy if I were using a single date value, by using the Month in the Master Calendar table as chart dimension. However, now I have a Date Range rather than a single date on which to link my data.
Any ideas as to how I could do this using Chart Functions? Or do I have to go back to my original solution of generating a Day or Month table in the load script?
Thanks in advance,
Will
- Mark as New
- Bookmark
- Subscribe
- Mute
- Subscribe to RSS Feed
- Permalink
- Report Inappropriate Content
Or do I have to go back to my original solution of generating a Day or Month table in the load script?
Yes, you are right here. You have to create a master calendar table.
- Mark as New
- Bookmark
- Subscribe
- Mute
- Subscribe to RSS Feed
- Permalink
- Report Inappropriate Content
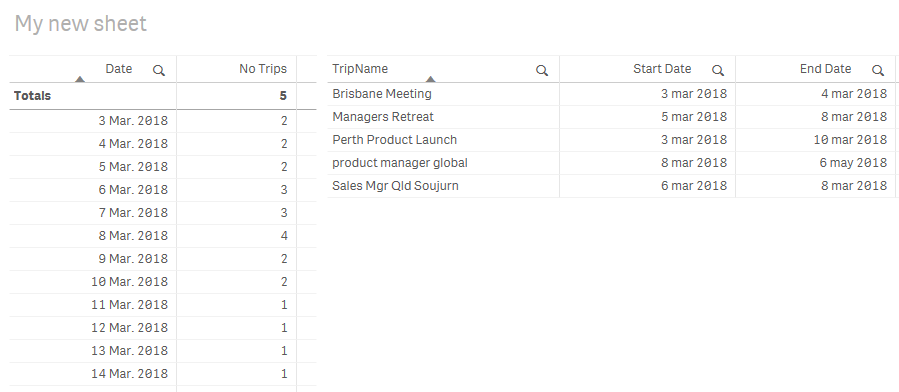
You need to create a master calendar of all the dates. Then use the intervalMatch function:
[Trips]:
LOAD * INLINE
[
TripName,Start Date,End Date
Brisbane Meeting,3 mar 2018,4 mar 2018
Perth Product Launch,3 mar 2018,10 mar 2018
Managers Retreat,5 mar 2018,8 mar 2018
product manager global,8 mar 2018,6 may 2018
Sales Mgr Qld Soujurn,6 mar 2018,8 mar 2018
](delimiter is ',');
MinMax:
Load Min([Start Date]) as MinDate,Max([End Date]) as MaxDate Resident Trips;
Let vMin = FieldValue('MinDate',1);
Let vMax = FieldValue('MaxDate',1);
Let vDays = vMax-vMin+1;
Drop Table MinMax;
Dates:
Load
Date($(vMin) + RowNo()-1) as Date
AutoGenerate ($(vDays));
Join (Dates)
IntervalMatch (Date)
Load [Start Date],[End Date] Resident Trips;
- Mark as New
- Bookmark
- Subscribe
- Mute
- Subscribe to RSS Feed
- Permalink
- Report Inappropriate Content
Hi Shane,
Thanks for your helpful response. I have had a play with your solution and it works well.
To take your scenario one step further, let's say that during each Trip there may also be Events that fall on any day within the Trip. If I wanted to count the number of Events using the same master calendar, e.g. the number of events for each month, how would I extend your solution to achieve this?
I've added the extra field below...changed the date formatting also.
Thanks,
Will
----
[Trips]:
LOAD * INLINE
[
TripName,Start Date,End Date, EventDate
Brisbane Meeting,3/3/2018,4/3/2018, 4/3/2018
Perth Product Launch,3/3/2018,10/3/2018, 9/3/2018
Managers Retreat,5/3/2018,8/3/2018, 6/3/2018
product manager global,8/3/2018,6/5/2018, 5/5/2018
Sales Mgr Qld Soujurn,6/3/2018,8/3/2018, 7/3/2018
](delimiter is ',');
MinMax:
Load
Min([Start Date]) as MinDate,
Max([End Date]) as MaxDate
Resident Trips;
Let vMin = FieldValue('MinDate',1);
Let vMax = FieldValue('MaxDate',1);
Let vDays = vMax-vMin+1;
Drop Table MinMax;
Dates:
Load
Date($(vMin) + RowNo()-1) as Date
AutoGenerate ($(vDays));
Join (Dates)
IntervalMatch (Date)
Load [Start Date],[End Date] Resident Trips;