Unlock a world of possibilities! Login now and discover the exclusive benefits awaiting you.
- Qlik Community
- :
- All Forums
- :
- QlikView App Dev
- :
- Group like Expression Results
- Subscribe to RSS Feed
- Mark Topic as New
- Mark Topic as Read
- Float this Topic for Current User
- Bookmark
- Subscribe
- Mute
- Printer Friendly Page
- Mark as New
- Bookmark
- Subscribe
- Mute
- Subscribe to RSS Feed
- Permalink
- Report Inappropriate Content
Group like Expression Results
Hi,
I have an expression which returns the project size based upon the total net sales of another dimension:
=If([Current Net Sales]>=3,'Large Project',if([Current Net Sales]>=1,'Medium Project',if([Current Net Sales]>=.3,'Small Project','Std Dealer Pricing')))
The chart then applies this to each line:
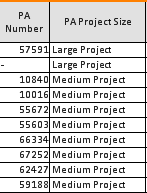
How can I have the chart group all like results together? In the above example there would then only be 3 lines (large project, medium project, small project). When I any of the dimensions, all I get is a grand total.
Thanks!
Accepted Solutions
- Mark as New
- Bookmark
- Subscribe
- Mute
- Subscribe to RSS Feed
- Permalink
- Report Inappropriate Content
Try as calculated dimension:
=Aggr(
If([Current Net Sales]>=3,'Large Project',if([Current Net Sales]>=1,'Medium Project',if([Current Net Sales]>=.3,'Small Project','Std Dealer Pricing'))),
[PA Number])
and as expression something like
=Count(DISTINCT [PA Number])
- Mark as New
- Bookmark
- Subscribe
- Mute
- Subscribe to RSS Feed
- Permalink
- Report Inappropriate Content
You sir, just made my day. Thanks a bunch!