Unlock a world of possibilities! Login now and discover the exclusive benefits awaiting you.
- Qlik Community
- :
- All Forums
- :
- QlikView App Dev
- :
- Get last value per year and month in accumulated.
- Subscribe to RSS Feed
- Mark Topic as New
- Mark Topic as Read
- Float this Topic for Current User
- Bookmark
- Subscribe
- Mute
- Printer Friendly Page
- Mark as New
- Bookmark
- Subscribe
- Mute
- Subscribe to RSS Feed
- Permalink
- Report Inappropriate Content
Get last value per year and month in accumulated.
Hi, In this line graph I get the accumulated values that the user requested, but want the value of the last month and year selected.
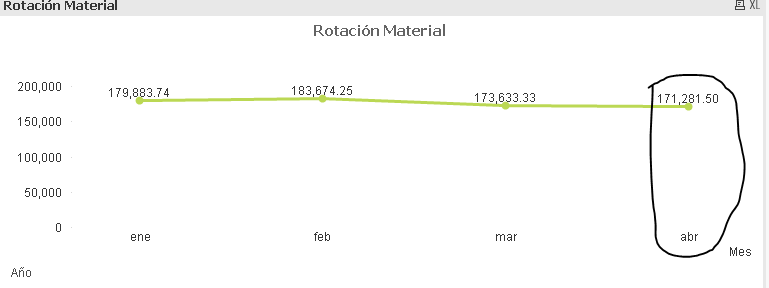
In this case the maximum value is 171281.50.
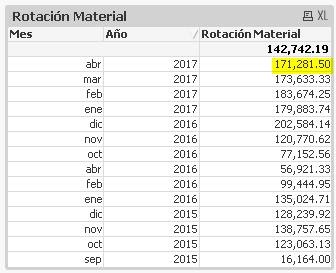
In this simple table there is no filter, therefore the maximum value April / 2017, if I select 2016 the maximum value is December / 2016.
Please, someone can help me how to solve this problem?.
I attach the QVW and Excel.
Do not forget to mark as "Accepted Solution" the comment that resolves the doubt.
Accepted Solutions
- Mark as New
- Bookmark
- Subscribe
- Mute
- Subscribe to RSS Feed
- Permalink
- Report Inappropriate Content
Try this
=FirstSortedValue(Aggr(Avg(Aggr(RangeSum(Above(Sum({$<Año,Nom_Mes>} [Ctd.en UM entrada]), 0, RowNo())), Material, (Fe.contabilización, (NUMERIC)))), Nom_Mes, Año), -Aggr(Nom_Mes + (Año*100), Nom_Mes, Año))
- Mark as New
- Bookmark
- Subscribe
- Mute
- Subscribe to RSS Feed
- Permalink
- Report Inappropriate Content
Thank you very much, is correct
Do not forget to mark as "Accepted Solution" the comment that resolves the doubt.