Unlock a world of possibilities! Login now and discover the exclusive benefits awaiting you.
- Qlik Community
- :
- All Forums
- :
- QlikView App Dev
- :
- Dynamic Selection of dates
- Subscribe to RSS Feed
- Mark Topic as New
- Mark Topic as Read
- Float this Topic for Current User
- Bookmark
- Subscribe
- Mute
- Printer Friendly Page
- Mark as New
- Bookmark
- Subscribe
- Mute
- Subscribe to RSS Feed
- Permalink
- Report Inappropriate Content
Dynamic Selection of dates
Hi Experts,
I have a table where i have a sales of Qty. I want to display as like if i select January it should display January total Qty like wise if i select August it should display upto August total Qty.
Ex: I have the following data
Date,Qty
01-01-2015,1
02-02-2015,2
03-03-2015,2
04-04-2015,
05-05-2015,
15-06-2015,5
02-12-2014,6
03-11-2014,7
04-10-2014,8
05-09-2014,9
01-01-2014,1
02-02-2014,2
03-03-2014,2
04-04-2014,
05-05-2014,
15-06-2014,5
02-12-2015,6
03-11-2015,7
04-10-2015,8
05-09-2015,9
- Tags:
- new_to_qlikview
- « Previous Replies
-
- 1
- 2
- Next Replies »
Accepted Solutions
- Mark as New
- Bookmark
- Subscribe
- Mute
- Subscribe to RSS Feed
- Permalink
- Report Inappropriate Content
Script:
Table:
LOAD Qty,
Date#(Date, 'DD-MM-YYYY') as Date,
Month(Date#(Date, 'DD-MM-YYYY')) as Month,
Year(Date#(Date, 'DD-MM-YYYY')) as Year,
MonthName(Date#(Date, 'DD-MM-YYYY')) as MonthYear;
LOAD * Inline [
Date,Qty
01-01-2015,1
02-02-2015,2
03-03-2015,2
04-04-2015,0
05-05-2015,0
15-06-2015,5
02-12-2014,6
03-11-2014,7
04-10-2014,8
05-09-2014,9
01-01-2014,1
02-02-2014,2
03-03-2014,2
04-04-2014,0
05-05-2014,0
15-06-2014,5
02-12-2015,6
03-11-2015,7
04-10-2015,8
05-09-2015,9
];
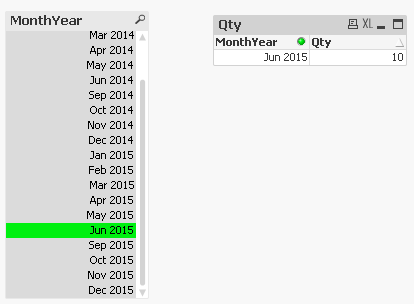
Dimension: MonthYear
This expression:
=If(Sum(Qty) > 0, RangeSum(Above(Sum({<MonthYear = , Year = {"=$(=Max(Year))"}>}Qty), 0, RowNo())))
Output:
- Mark as New
- Bookmark
- Subscribe
- Mute
- Subscribe to RSS Feed
- Permalink
- Report Inappropriate Content
Something like this:
PFA a qvw document for reference.
Best,
Sunny
- Mark as New
- Bookmark
- Subscribe
- Mute
- Subscribe to RSS Feed
- Permalink
- Report Inappropriate Content
Hi sunindia
Could you please provide expression.
- Mark as New
- Bookmark
- Subscribe
- Mute
- Subscribe to RSS Feed
- Permalink
- Report Inappropriate Content
Expression was very simple: =Sum(Qty)
- Mark as New
- Bookmark
- Subscribe
- Mute
- Subscribe to RSS Feed
- Permalink
- Report Inappropriate Content
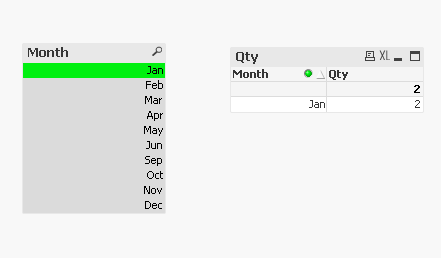
sunindia,
I want to display as if i select Jan 2015 it should show Qty as 1 likewise if i select June 2015 it should display upto June total Qty as 10.
- Mark as New
- Bookmark
- Subscribe
- Mute
- Subscribe to RSS Feed
- Permalink
- Report Inappropriate Content
June would be Qty = 5, right:
Date,Qty
01-01-2015,1
02-02-2015,2
03-03-2015,2
04-04-2015,
05-05-2015,
15-06-2015,5
02-12-2014,6
03-11-2014,7
04-10-2014,8
05-09-2014,9
01-01-2014,1
02-02-2014,2
03-03-2014,2
04-04-2014,
05-05-2014,
15-06-2014,5
02-12-2015,6
03-11-2015,7
04-10-2015,8
05-09-2015,9
Script:
Table:
LOAD Qty,
Date#(Date, 'DD-MM-YYYY') as Date,
Month(Date#(Date, 'DD-MM-YYYY')) as Month,
MonthName(Date#(Date, 'DD-MM-YYYY')) as MonthYear;
LOAD * Inline [
Date,Qty
01-01-2015,1
02-02-2015,2
03-03-2015,2
04-04-2015,
05-05-2015,
15-06-2015,5
02-12-2014,6
03-11-2014,7
04-10-2014,8
05-09-2014,9
01-01-2014,1
02-02-2014,2
03-03-2014,2
04-04-2014,
05-05-2014,
15-06-2014,5
02-12-2015,6
03-11-2015,7
04-10-2015,8
05-09-2015,9
];
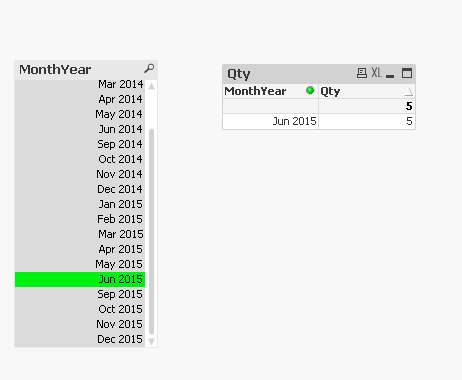
Dimension: MonthYear
Expression: Sum(Qty)
Output:
- Mark as New
- Bookmark
- Subscribe
- Mute
- Subscribe to RSS Feed
- Permalink
- Report Inappropriate Content
Nope, for June it should display 10.....I mean it should add Jan, feb, march.....upto June
- Mark as New
- Bookmark
- Subscribe
- Mute
- Subscribe to RSS Feed
- Permalink
- Report Inappropriate Content
Oh okay, got it. Let me work on that
- Mark as New
- Bookmark
- Subscribe
- Mute
- Subscribe to RSS Feed
- Permalink
- Report Inappropriate Content
Script:
Table:
LOAD Qty,
Date#(Date, 'DD-MM-YYYY') as Date,
Month(Date#(Date, 'DD-MM-YYYY')) as Month,
Year(Date#(Date, 'DD-MM-YYYY')) as Year,
MonthName(Date#(Date, 'DD-MM-YYYY')) as MonthYear;
LOAD * Inline [
Date,Qty
01-01-2015,1
02-02-2015,2
03-03-2015,2
04-04-2015,0
05-05-2015,0
15-06-2015,5
02-12-2014,6
03-11-2014,7
04-10-2014,8
05-09-2014,9
01-01-2014,1
02-02-2014,2
03-03-2014,2
04-04-2014,0
05-05-2014,0
15-06-2014,5
02-12-2015,6
03-11-2015,7
04-10-2015,8
05-09-2015,9
];
Dimension: MonthYear
This expression:
=If(Sum(Qty) > 0, RangeSum(Above(Sum({<MonthYear = , Year = {"=$(=Max(Year))"}>}Qty), 0, RowNo())))
Output:
- Mark as New
- Bookmark
- Subscribe
- Mute
- Subscribe to RSS Feed
- Permalink
- Report Inappropriate Content
Thank You Sunny:)
- « Previous Replies
-
- 1
- 2
- Next Replies »