Unlock a world of possibilities! Login now and discover the exclusive benefits awaiting you.
- Qlik Community
- :
- All Forums
- :
- QlikView App Dev
- :
- Dynamic Chart and Dynamic Files
- Subscribe to RSS Feed
- Mark Topic as New
- Mark Topic as Read
- Float this Topic for Current User
- Bookmark
- Subscribe
- Mute
- Printer Friendly Page
- Mark as New
- Bookmark
- Subscribe
- Mute
- Subscribe to RSS Feed
- Permalink
- Report Inappropriate Content
Dynamic Chart and Dynamic Files
| Full Text Reason Code | Days Bucket | Amount |
| 101 - Cash Application Issue | 16-30 Days | 10 |
| 101 - Cash Application Issue | 16-30 Days | 20 |
| 101 - Cash Application Issue | 16-30 Days | 30 |
| 101 - Cash Application Issue | 16-30 Days | 40 |
| 101 - Cash Application Issue | 1-15 Days | 50 |
| 101 - Cash Application Issue | 1-15 Days | 15 |
| 101 - Cash Application Issue | 1-15 Days | 25 |
| 100 - Please Select | 16-30 Days | 35 |
| 100 - Please Select | 1-15 Days | 2 |
| 100 - Please Select | 16-30 Days | 3 |
| 100 - Please Select | 16-30 Days | 4 |
I'm displaying a report Pivot table like this:
| (Count Days Bucket) | (Sum of Amount) | ||||
| Row Labels | 1-15 Days | 16-30 Days | 1-15 Days | 16-30 Days | |
| 100 - Please Select | 1 | 3 | 2 | 42 | |
| 101 - Cash Application Issue | 3 | 4 | 90 | 100 | |
Now the next challenge is that this only data for 1 month.
So each month has its own excel file.
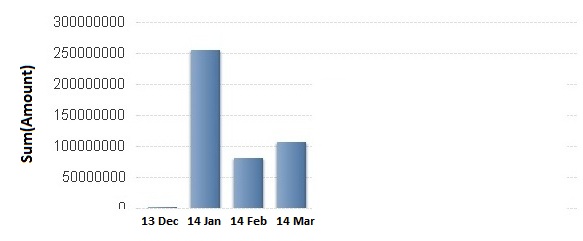
I would like the report to search all excel files in the directory (they have a naming convention: YEAR_MONTH.xlsx) and show me a Bar Chart with 2 dimensions: YEAR_MONTH on x axis, and Sum(Amount) (based on Raw Data would be 234 for this example) on y axis.
I would like also every time I copy a new file with a new month to the report directory, the chart auto updates with a new month for infinite months.
Last but not the least I would like to click on a bar corresponding to a month a automatically show the corresponding Pivot Report table for that month.
This is followed by this previous thread: http://community.qlik.com/thread/95965, but you don't need to read the previous one because it was a confusion already.
Thanks,
Miguel
- Mark as New
- Bookmark
- Subscribe
- Mute
- Subscribe to RSS Feed
- Permalink
- Report Inappropriate Content
If in your directory there is only this type of file : YEAR_MONTH.xlsx, then, you can load all the file of your directory by using " *.xlsx " instead of " 2013_10.xlsx " or you can try "????_??.xlsx".
"*" replace all caracters and no limit of caracters
"?" replace only one caracter.
- Mark as New
- Bookmark
- Subscribe
- Mute
- Subscribe to RSS Feed
- Permalink
- Report Inappropriate Content
AS Vivien said, if you only have that type of file in your directory you can use the wildcards proposed.
As for the automatic pivot table when clicking on a bar, that's not a default behavior so the only way to achieve that without getting into macros, because I don't use them and don't know how to code them, would be to enable that type of chart in the Fast Type Change option. So.. once the user has selected a bar, it'll have to click on that icon to see the pivot table representation.
Perhaps you could simulate that kind of behavior using the show conditional option in the ( Object Properties: Layout tab ), So, you'll have two objects, the bar chart and the pivot table.
The bar chart would have the next expression:
GetPossibleCount(YEAR_MONTH) > 1
While the pivot table the opposite:
GetPossibleCount(YEAR_MONTH) = 1
Whenever the user selects only one YEAR_MONTH, the pivot table will be shown, otherwise the bar chart will be visible.
Hope it helps!
- Mark as New
- Bookmark
- Subscribe
- Mute
- Subscribe to RSS Feed
- Permalink
- Report Inappropriate Content
So here's my strategy to implement this.
I'll post here some pseudo code and you tell me if it's a good idea.
Re: Dynamic Chart and Dynamic Files
do not forget that I just want to create a pivot table in my qlikview report and I don't want to create a new qlikview report table each time a new month is added. So I didn't understand your help, but thanks anyway.
Begin Pseudocode:
var fileArray = GetFilesFromDir();
var finalTable;
foreach(file in fileArray)
{
var yearMonth = GetFromFile(file);
var currentTable = LOAD yearMonth as YEAR_MONTH, * FROM file;
Concatenate(finalTable, currentTable);
}
For the bar chart:
Use column YEAR_MONTH as 1st dimension. So when I click on a month it will filter the pivot table automatically.
End Pseudocode.
Thanks,
Miguel
- Mark as New
- Bookmark
- Subscribe
- Mute
- Subscribe to RSS Feed
- Permalink
- Report Inappropriate Content
Check the attachment.
It contains a small example of what I tried to explain in my previous post.
Hope it helps!