Unlock a world of possibilities! Login now and discover the exclusive benefits awaiting you.
- Qlik Community
- :
- All Forums
- :
- QlikView App Dev
- :
- Difference between days in line chart mouseover
- Subscribe to RSS Feed
- Mark Topic as New
- Mark Topic as Read
- Float this Topic for Current User
- Bookmark
- Subscribe
- Mute
- Printer Friendly Page
- Mark as New
- Bookmark
- Subscribe
- Mute
- Subscribe to RSS Feed
- Permalink
- Report Inappropriate Content
Difference between days in line chart mouseover
Hi Everyone,
I have a requirement to create a line chart that shows the median difference between subject enrollment.
My data would look like:
LOAD * INLINE [
Location, Subject, Days_To_Enroll
A, 1, 10
A, 2, 20
A, 3, 25
A, 4, 32
A, 5, 43
B, 1, 20
B, 2, 30
B, 3, 32,
B, 4, 43
B, 5, 49
C, 1, 20
]
The Days_To_Enroll will be the running total.
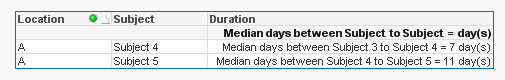
I am able to create the chart but in mouse over value I need to show the difference between the current value and the previous value. Ex: The mouse over value for Location = A and Subject = 3, should show the days difference as 5 (Since Subject 3, Location A has 25 and Subject 2, Location A has 20, the difference is 5).
NOTE: Even if only Subject 3 & 4 are selected the mouse over for 3 should still show the difference between days for Subject 2 & Subject 3.
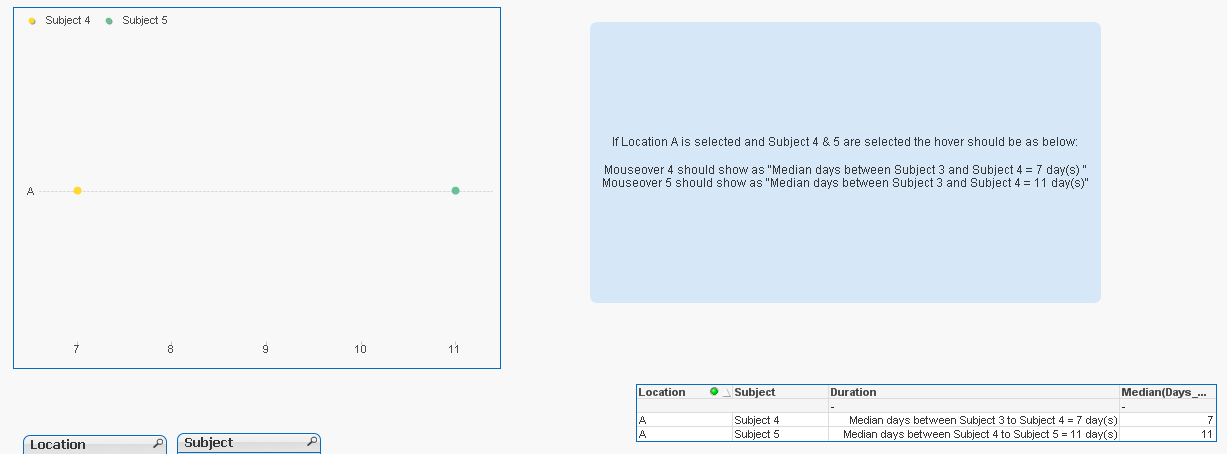
Please see attached file. I have created the chart but not able to get the mouse over to show correct values and also when filters are applied the first subject mouse over is always broken. Any help would be greatly appreciated.
Accepted Solutions
- Mark as New
- Bookmark
- Subscribe
- Mute
- Subscribe to RSS Feed
- Permalink
- Report Inappropriate Content
Can you try this:
Dual(
'Median days between Subject ' & (Subject - 1) & ' to Subject ' & Subject & ' = ' &
(Median(Aggr(Median(Days_To_Enroll), City, Arm, Location, Subject)) - Aggr(Above(Median({<Location, Subject>}Aggr(Median({<Location, Subject>}Days_To_Enroll), Location, Subject, City, Arm))), Location, Subject))
// The metric that needs to shown here is the days difference between current subject minus previous subject
& ' day(s)'
,
Median(Aggr(Median(Days_To_Enroll), City, Arm, Location, Subject))
)
- Mark as New
- Bookmark
- Subscribe
- Mute
- Subscribe to RSS Feed
- Permalink
- Report Inappropriate Content
May be try this:
Dual(
'Median days between Subject ' & (Subject - 1) & ' to Subject ' & Subject & ' = ' &
(Median(Days_To_Enroll) - Aggr(Above(Median({<Location, Subject>}Days_To_Enroll)), Location, Subject))
// The metric that needs to shown here is the days difference between current subject minus previous subject
& ' day(s)'
,
Median(Days_To_Enroll) - Aggr(Above(Median({<Location, Subject>}Days_To_Enroll)), Location, Subject)
)
- Mark as New
- Bookmark
- Subscribe
- Mute
- Subscribe to RSS Feed
- Permalink
- Report Inappropriate Content
Hello
Please see attachment, if it's what you need.
Regards
Julian
- Mark as New
- Bookmark
- Subscribe
- Mute
- Subscribe to RSS Feed
- Permalink
- Report Inappropriate Content
Hi Sunny,
Thanks for your input but apologies for not making the scenario complete. I have data with 4 levels and the chart should show median at 2 level.
Please see the updated qvw attached. I did try your approach with this scenario but still couldn't get it to work. The above function works if no filters are applied but when filters are applied the first subject mouseover is always null
Thanks!
- Mark as New
- Bookmark
- Subscribe
- Mute
- Subscribe to RSS Feed
- Permalink
- Report Inappropriate Content
Hi Julian,
Please see my above reply. I have few more level of granularity and with that it is not working. Thanks for your help.
- Mark as New
- Bookmark
- Subscribe
- Mute
- Subscribe to RSS Feed
- Permalink
- Report Inappropriate Content
Can you try this:
Dual(
'Median days between Subject ' & (Subject - 1) & ' to Subject ' & Subject & ' = ' &
(Median(Aggr(Median(Days_To_Enroll), City, Arm, Location, Subject)) - Aggr(Above(Median({<Location, Subject>}Aggr(Median({<Location, Subject>}Days_To_Enroll), Location, Subject, City, Arm))), Location, Subject))
// The metric that needs to shown here is the days difference between current subject minus previous subject
& ' day(s)'
,
Median(Aggr(Median(Days_To_Enroll), City, Arm, Location, Subject))
)
- Mark as New
- Bookmark
- Subscribe
- Mute
- Subscribe to RSS Feed
- Permalink
- Report Inappropriate Content
That worked!  Thanks a lot!
- Mark as New
- Bookmark
- Subscribe
- Mute
- Subscribe to RSS Feed
- Permalink
- Report Inappropriate Content
Awesome, I am glad it did