Unlock a world of possibilities! Login now and discover the exclusive benefits awaiting you.
- Qlik Community
- :
- All Forums
- :
- QlikView App Dev
- :
- Data Selection
- Subscribe to RSS Feed
- Mark Topic as New
- Mark Topic as Read
- Float this Topic for Current User
- Bookmark
- Subscribe
- Mute
- Printer Friendly Page
- Mark as New
- Bookmark
- Subscribe
- Mute
- Subscribe to RSS Feed
- Permalink
- Report Inappropriate Content
Data Selection
HI Guys,
my fact-data table is linked to the master calendar based on the INVOICE_DATE.
Now i would like to create a graph, where the user can see data by Year/Month coming from another field (DIFF_DATE2).
There's any way to use the same selection done on the master calendar, to drive the selection on another field?
An example: have a graph where if on master calendar is selected Month = April and Year= 2017 shows all data where DIFF_DATE2 equal to Month= April and Year = 2017, so not related to the Invoice_date?
Thansk
- Mark as New
- Bookmark
- Subscribe
- Mute
- Subscribe to RSS Feed
- Permalink
- Report Inappropriate Content
Try,
Sum({<DIFF_DATE2 = p({<Month = {"$(=max(Month))"},Year = {"$(=Max(Year))"}>}Month), Month=,Year=>}Value)
- Mark as New
- Bookmark
- Subscribe
- Mute
- Subscribe to RSS Feed
- Permalink
- Report Inappropriate Content
what if i try with this logic
=Sum({<Year=,Month=,Year_Surgery={Year}, Month_Surgery={Month}>}WI_EUR)
can be working in this way? i tried but i didnt get any value
- Mark as New
- Bookmark
- Subscribe
- Mute
- Subscribe to RSS Feed
- Permalink
- Report Inappropriate Content
=Sum({<Invoice_Date_Num=,Month_Surgery={"$(=GetFieldSelections(Month))"},Day=,Year=,Month=,Year_Surgery={"$(=GetFieldSelections(Year))"}>}WI_EUR)
i'm using this one now, and it works only if i remove MOnth_Surgery from the set analysis. Anyone knows why?
- Mark as New
- Bookmark
- Subscribe
- Mute
- Subscribe to RSS Feed
- Permalink
- Report Inappropriate Content
This works when we are selecting only one. But if you select multi then it won't for that try this?
=Sum({<Invoice_Date_Num=,Month_Surgery={$(=Concat(Chr(39) & GetFieldSelections(Month) & Chr(39), ','))}, Day=,Year=,Month=,Year_Surgery={$(=Concat(Chr(39) & GetFieldSelections(Year_Surgery) & Chr(39), ','))}>}WI_EUR)
- Mark as New
- Bookmark
- Subscribe
- Mute
- Subscribe to RSS Feed
- Permalink
- Report Inappropriate Content
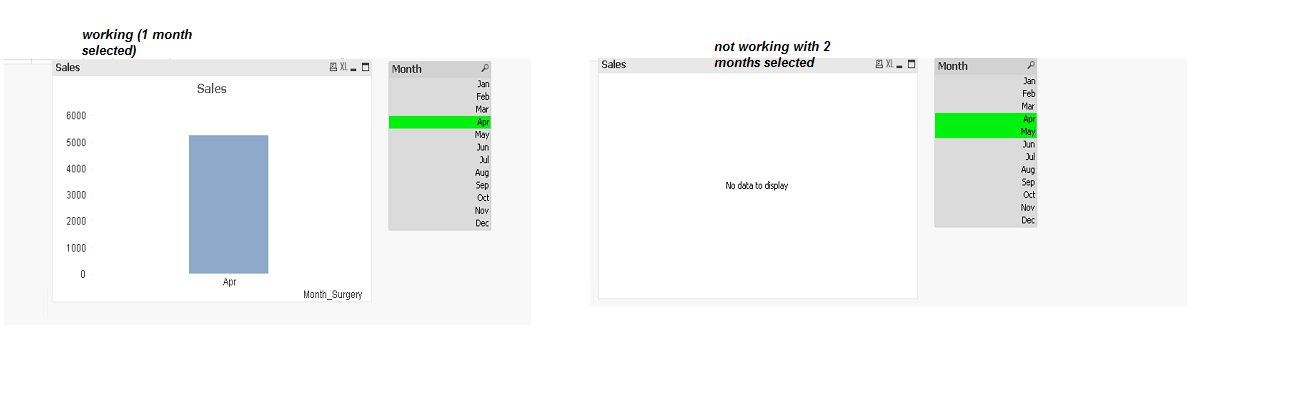
Works, but only selecting ONE month and JUST ONE yea.
I have to put this information in a graph by months.
Is something possible adjusting somehow the formula?
Thanks
- Mark as New
- Bookmark
- Subscribe
- Mute
- Subscribe to RSS Feed
- Permalink
- Report Inappropriate Content
For sure, This will work. Not sure what you mean to say. Can you elaborate more
- Mark as New
- Bookmark
- Subscribe
- Mute
- Subscribe to RSS Feed
- Permalink
- Report Inappropriate Content
Hi,
this is what i mean, i would like to have a graph with all month , but if more than one is selected the formula doens't work anymore.
What can i do?