Unlock a world of possibilities! Login now and discover the exclusive benefits awaiting you.
- Qlik Community
- :
- All Forums
- :
- QlikView App Dev
- :
- Daily Historical Reporting
- Subscribe to RSS Feed
- Mark Topic as New
- Mark Topic as Read
- Float this Topic for Current User
- Bookmark
- Subscribe
- Mute
- Printer Friendly Page
- Mark as New
- Bookmark
- Subscribe
- Mute
- Subscribe to RSS Feed
- Permalink
- Report Inappropriate Content
Daily Historical Reporting
Hi,
I have a load script that loads data with a timestamp into a qvd and gives me a table of data with multiple records per unique Primary Key with the timestamps. The load happens multiple times a day.
The base data looks like this:
| Team | VolumeOfCalls | TimepStamp |
| A | 15 | 22/01/2018 15:00 |
| B | 9 | 22/01/2018 15:00 |
| C | 20 | 22/01/2018 15:00 |
| A | 20 | 22/01/2018 17:00 |
| B | 10 | 22/01/2018 17:00 |
| C | 25 | 22/01/2018 17:00 |
| A | 20 | 23/01/2018 15:00 |
| B | 10 | 23/01/2018 15:00 |
| C | 25 | 23/01/2018 15:00 |
| A | 25 | 23/01/2018 17:00 |
| B | 15 | 23/01/2018 17:00 |
| C | 30 | 23/01/2018 17:00 |
I want to report daily volumes at the end of each day like below:
| Sum of VolumeOfCalls | TimepStamp | ||
| Team | 22/01/2018 | 23/01/2018 | Grand Total |
| A | 20 | 25 | 45 |
| B | 10 | 15 | 25 |
| C | 25 | 30 | 55 |
| Grand Total | 55 | 70 | 125 |
Any pointers on how to achieve this as I'm struggling. I need to be able to identify the max timpestamp for each day and only report off that.
Thanks
- Mark as New
- Bookmark
- Subscribe
- Mute
- Subscribe to RSS Feed
- Permalink
- Report Inappropriate Content
May be this
Dimension
Team
DateField
Expression
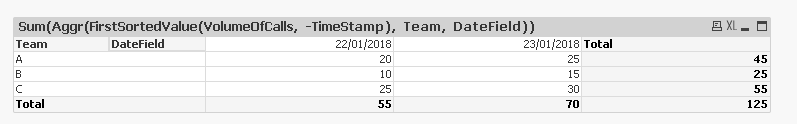
Sum(Aggr(FirstSortedValue(VolumeOfCalls, -TimeStamp), Team, DateField))
Where DateField is created in the script like this
Date(Floor(TimeStamp)) as DateField
- Mark as New
- Bookmark
- Subscribe
- Mute
- Subscribe to RSS Feed
- Permalink
- Report Inappropriate Content
Sample and sample image attached