Unlock a world of possibilities! Login now and discover the exclusive benefits awaiting you.
- Qlik Community
- :
- All Forums
- :
- QlikView App Dev
- :
- Creating dynamic Reference Lines in a Bar Chart
- Subscribe to RSS Feed
- Mark Topic as New
- Mark Topic as Read
- Float this Topic for Current User
- Bookmark
- Subscribe
- Mute
- Printer Friendly Page
- Mark as New
- Bookmark
- Subscribe
- Mute
- Subscribe to RSS Feed
- Permalink
- Report Inappropriate Content
Creating dynamic Reference Lines in a Bar Chart
Hello everyone,
I am creating a Bar Chart which displays the Turnover percentage of each area of a Company.
I want do add a reference line to the chart, that change the value when the user apply a filter.
Below is the field and value that i want to add as a Reference Line:
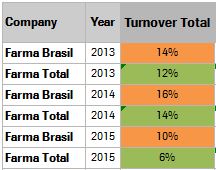
"Farma Brasil" will be one Reference Line and "Farma Total" will be the second Reference Line.
So, whenever the user filter the year, the line value should change according to the "Turnover Total" value.
Thanks
- Tags:
- new_to_qlikview
Accepted Solutions
- Mark as New
- Bookmark
- Subscribe
- Mute
- Subscribe to RSS Feed
- Permalink
- Report Inappropriate Content
Add two reference lines as below
Avg({<Company = {'Farma Brasil'}>}[Turnover Total])
Avg({<Company = {'Farma Total'}>}[Turnover Total])
- Mark as New
- Bookmark
- Subscribe
- Mute
- Subscribe to RSS Feed
- Permalink
- Report Inappropriate Content
Create two reference lines on presentation tab.
The expression for the reference lines may look like
=Only({<Company = {'Farma Brasil'}>} [Turnover Total])
resp.
=Only({<Company = {'Farma Total'}>} [Turnover Total])
and will only return a values with a selected Year.
- Mark as New
- Bookmark
- Subscribe
- Mute
- Subscribe to RSS Feed
- Permalink
- Report Inappropriate Content
Add two reference lines as below
Avg({<Company = {'Farma Brasil'}>}[Turnover Total])
Avg({<Company = {'Farma Total'}>}[Turnover Total])