Unlock a world of possibilities! Login now and discover the exclusive benefits awaiting you.
- Qlik Community
- :
- All Forums
- :
- QlikView App Dev
- :
- Create two Tables (Charts) based on Filter
- Subscribe to RSS Feed
- Mark Topic as New
- Mark Topic as Read
- Float this Topic for Current User
- Bookmark
- Subscribe
- Mute
- Printer Friendly Page
- Mark as New
- Bookmark
- Subscribe
- Mute
- Subscribe to RSS Feed
- Permalink
- Report Inappropriate Content
Create two Tables (Charts) based on Filter
Hi,
I have a PivotTable that has few dimensions and expressions. I have another field 'Category' which has 'In' and 'Out' values.
I want to create two different tables for each category and only show Category as 'In' in Table 1 and 'Out' in Table 2. Whenever I use the expression =if(Category)='In',Category) or =if(Category)='Out',Category) in my Dimensions and Check 'Supress Null Values', I am able to see the tables for each but that is only showing Columns which are related to In or Out. I want all the Columns to be shown but values to be shown only for those that Satisfy Category filter.
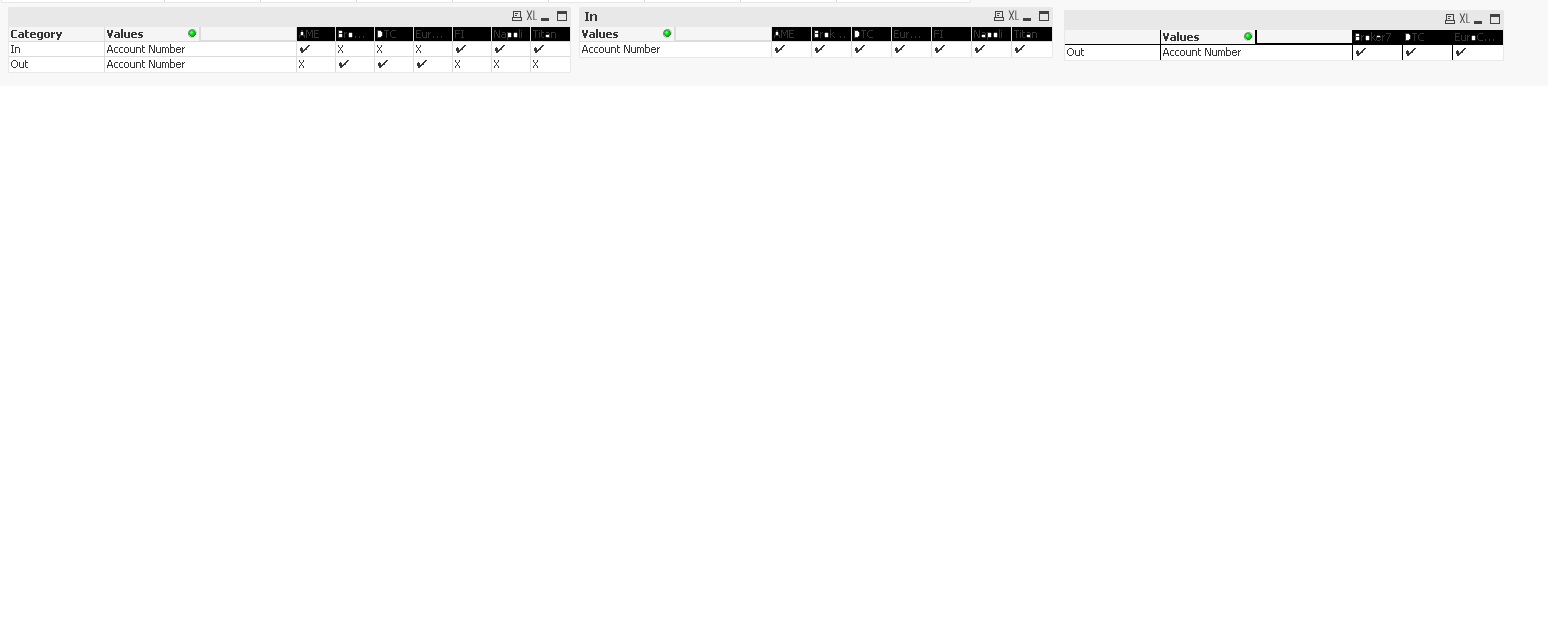
In the below image, the Columns for In shows all because it satisfies the condition. But for Out, it only shows three columns since it only has those columns satisfying 'Category='Out'. But I want to show all columns in In and Out tables (but the cells can be empty or 'X')
- Mark as New
- Bookmark
- Subscribe
- Mute
- Subscribe to RSS Feed
- Permalink
- Report Inappropriate Content
Difficult to say for sure without knowing your expressions
But i think you shouldnt Suppress Null Values.
Also for performance sake use set analysis
- Mark as New
- Bookmark
- Subscribe
- Mute
- Subscribe to RSS Feed
- Permalink
- Report Inappropriate Content
Sample QVW app please
- Mark as New
- Bookmark
- Subscribe
- Mute
- Subscribe to RSS Feed
- Permalink
- Report Inappropriate Content
Hi Dilip,
My Expressions are quite simple. If(Value='Yes', '✔','X')
And I cannot use Set Analysis in this case since it's not a Sum or Count. Tried Only in Dimensions - only({<Category={'In'}>} Category) in Table 1 and only({<Category={'Out'}>} Category) in Table 2 but no help.
- Mark as New
- Bookmark
- Subscribe
- Mute
- Subscribe to RSS Feed
- Permalink
- Report Inappropriate Content
Ah ok. Shouldnt matter in that case.Any luck with the removing the suppress?
its weird then. try and share a sample if you can