Unlock a world of possibilities! Login now and discover the exclusive benefits awaiting you.
- Qlik Community
- :
- All Forums
- :
- QlikView App Dev
- :
- Count run of negative values
- Subscribe to RSS Feed
- Mark Topic as New
- Mark Topic as Read
- Float this Topic for Current User
- Bookmark
- Subscribe
- Mute
- Printer Friendly Page
- Mark as New
- Bookmark
- Subscribe
- Mute
- Subscribe to RSS Feed
- Permalink
- Report Inappropriate Content
Count run of negative values
Hi,
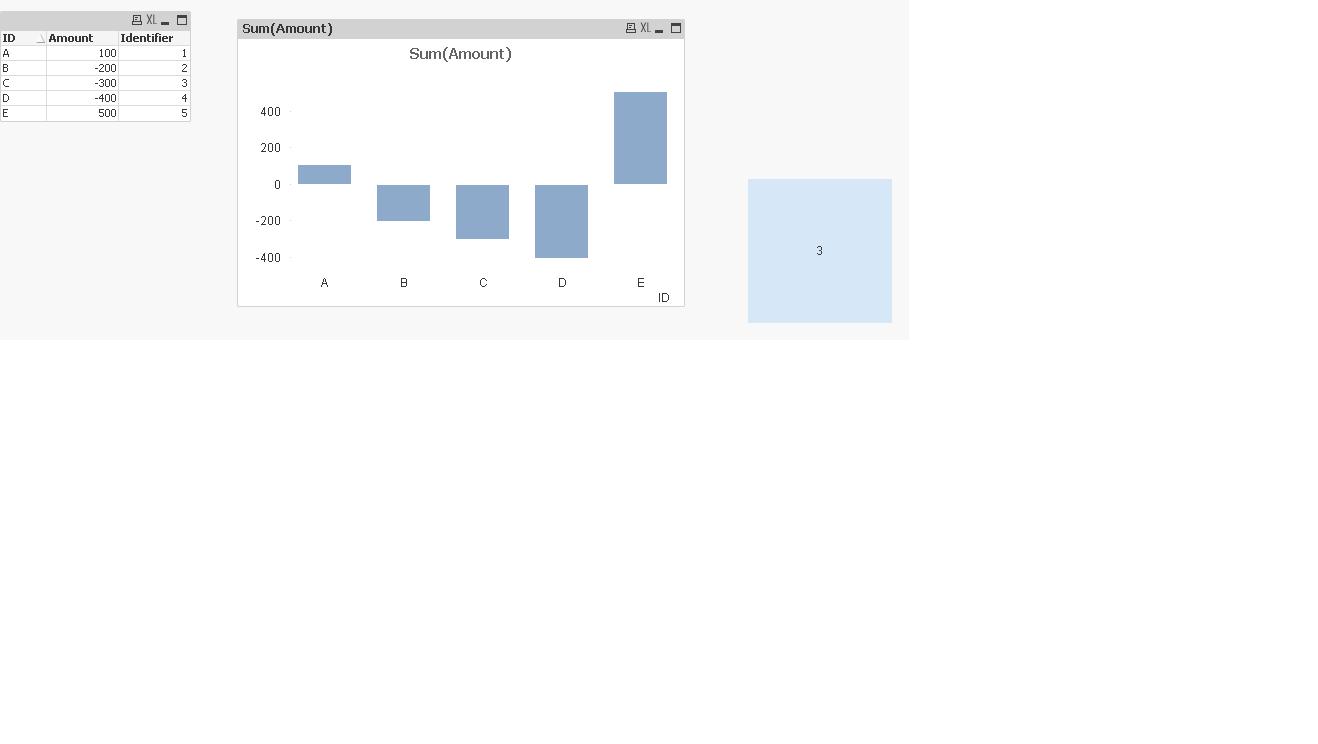
I have a dataset with positive and negative values. Within the dataset there is a unique identifier that start at '1' and increments by 1 for each row. Is it possible to count the maximum occurrence of a run of negative values eg,
so using the above example I would like to show '5' in a text box the the largest consecutive run of negative values is 5..
Is this possible?
Many thanks
- Mark as New
- Bookmark
- Subscribe
- Mute
- Subscribe to RSS Feed
- Permalink
- Report Inappropriate Content
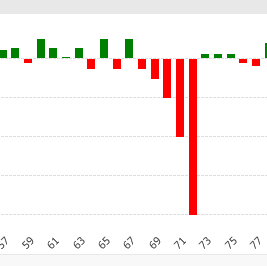
You can maybe do it like shown here
add a preceding load:
LOAD *,
If(Sign(Indicator) =1, DaysWithTrend,0) as DaysWithPositiveTrend,
If(Sign(Indicator) =-1, DaysWithTrend,0) as DaysWithNegativeTrend
;
Load *,
If( Change * Peek( Change ) > 0,
Peek( TrendID ),
RangeSum( 1, Peek( TrendID ))
) as TrendID,
If( Change * Peek( Change ) > 0,
RangeSum( 1, Peek( DaysWithTrend )),
0
) as DaysWithTrend;
Load
Indicator,
Indicator - Peek( Indicator ) as Change
Resident Daily_TQM_Measurement
Order By Date;
Then in your text box:
=Max( DaysWithNegativeTrend)
- Mark as New
- Bookmark
- Subscribe
- Mute
- Subscribe to RSS Feed
- Permalink
- Report Inappropriate Content
May be as attached: