Unlock a world of possibilities! Login now and discover the exclusive benefits awaiting you.
- Qlik Community
- :
- All Forums
- :
- QlikView App Dev
- :
- Comparative Analysis performance improvement neede...
- Subscribe to RSS Feed
- Mark Topic as New
- Mark Topic as Read
- Float this Topic for Current User
- Bookmark
- Subscribe
- Mute
- Printer Friendly Page
- Mark as New
- Bookmark
- Subscribe
- Mute
- Subscribe to RSS Feed
- Permalink
- Report Inappropriate Content
Comparative Analysis performance improvement needed
Hi
I have the following application where:
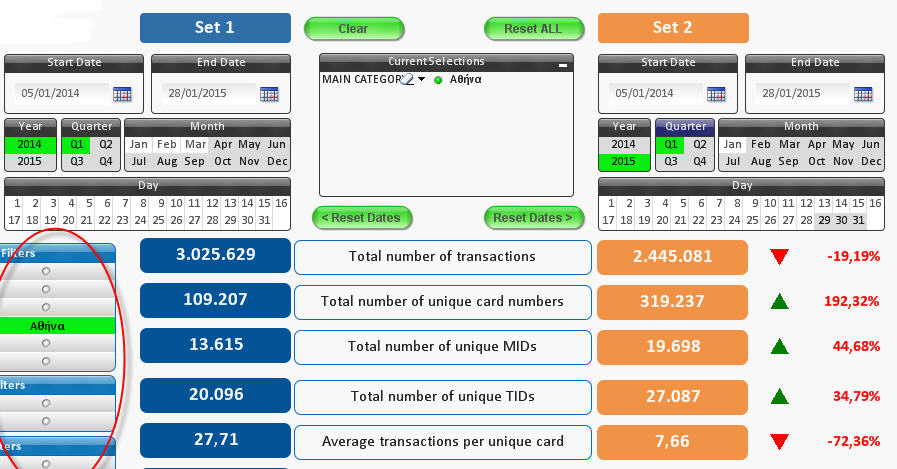
What it does: (see image below)
- I have 2 sets (alternate states) of dates (Year, Quarter etc), Group1 on the left and Group2 on the right.
- There is a set of "filters" (see ringed) that the user can choose which apply to BOTH sets
- I have a number of KPIs (Key Performance Indicators) comparing Set1 vs.Set2 (e.g. "Total number of transactions")
- The results of Set 1 (i.e. dates selected in the left set plus filters) are shown in BLUE and for Set 2 in ORANGE
- The Set1 vs. Set2 results are compared and an indicator ('=', '▼', '▲') is displayed to show equal, Set2 less than Set1 or Set2 more than Set1, respectively.
- The '=' indicator should be shown in blue, '▼' in red and '▲' in green
- Finally the "difference" between Set1 and Set2 is shown as a percentage (e.g. -19,19% in the first KPI)
- The percentage colour also reflects the blue=equal, less than is red and more than is green.

How we do it:
- Some of the above KPIs are more complex than others, but I use variables throughout to define each formula used.
- An example for the first KPI might be:
=$(vTotalTransactionsSet1) for the Set1 result, where
vTotalTransactionsSet1 =
sum({<
[AuthorisationDate] = {'>=$(=Date(vStartDate1))<=$(=Date(vEndDate1))'},
[Authorisations Year] = [Group1]::[Authorisations Year],
[Authorisations Quarter] = [Group1]::[Authorisations Quarter],
[Authorisations Month] = [Group1]::[Authorisations Month],
[Authorisations Week] = [Group1]::[Authorisations Week],
[Authorisations Day] = [Group1]::[Authorisations Day],
[TerminalsID] = {'<> 00'},
[TransactionAmmount] = {'> 0'}
>} AuthorisationRec)
- For the second set (Set2 on the right side) it is the same as above replacing [Group1] with [Group2] and vStartDate1 with vStartDate2 and EndDate1 with EndDate2
- Some of the KPIs are more complex - for example the 5th one in the list above (Average transactions....) might be:
=$(vTotalTransactionsSet1) / $(vTotalUniqueCardNumbersSet1)
What can be improved:
- There are a number of calculations that are been repeated in EACH KPI - for example vTotalTransactionsSet1 is a common one that is used in a number of different KPIs above - would there be a way of calculating it just once when selections are made and reusing it?
- As explained earlier, apart from the result, we use the same formula to establish if ('=', '▼', '▲'):
e.g. = if($(vTotalTransactionsSet2) = $(vTotalTransactionsSet1), '=',
if($(vTotalTransactionsSet2) > $(vTotalTransactionsSet1), '▲', '▼')) - We then use the SAME formula again to calculate the font colour these should be:
e.g. = if($(vTotalTransactionsSet2) = $(vTotalTransactionsSet1), Blue(),
if($(vTotalTransactionsSet2) > $(vTotalTransactionsSet1), Green(), Red()))
- We then use a similar formula again to calculate the Difference:
e.g. = ($(vTotalTransactionsSet2) - $(vTotalTransactionsSet1)) / $(vTotalTransactionsSet1)
- And finally we use the SAME colour formula as used previously to establish the font colour for the difference:
e.g. = if($(vTotalTransactionsSet2) = $(vTotalTransactionsSet1), Blue(),
if($(vTotalTransactionsSet2) > $(vTotalTransactionsSet1), Green(), Red()))
THERE HAS TO BE MORE EFFICIENT WAYS OF DOING THIS, SURELY
I await your suggestions with baited breath
Thanks in advance
Alexis
- Mark as New
- Bookmark
- Subscribe
- Mute
- Subscribe to RSS Feed
- Permalink
- Report Inappropriate Content
By putting an = character in front of an expression in a variable it will be calculated outside the context of the object the variable is used in. So you can try this:
vTotalTransactionsSet1:
=sum({<
[AuthorisationDate] = {'>=$(=Date(vStartDate1))<=$(=Date(vEndDate1))'},
[Authorisations Year] = [Group1]::[Authorisations Year],
[Authorisations Quarter] = [Group1]::[Authorisations Quarter],
[Authorisations Month] = [Group1]::[Authorisations Month],
[Authorisations Week] = [Group1]::[Authorisations Week],
[Authorisations Day] = [Group1]::[Authorisations Day],
[TerminalsID] = {'<> 00'},
[TransactionAmmount] = {'> 0'}
>} AuthorisationRec)
Also, Qlikview will cache results from calculated expressions. So if you reuse an expression in a chart then Qlikview will get the results from the cache. This also applies to reusing expressions in different text boxes. If the context is the same then the expression will return the same result so the value can be retrieved from the cache. No performance penalty there.
talk is cheap, supply exceeds demand
- Mark as New
- Bookmark
- Subscribe
- Mute
- Subscribe to RSS Feed
- Permalink
- Report Inappropriate Content
Hi Gysbert,
Thanks for taking the time to respond. If you look at my original posting my variable definition DOES have an "=" sign...
e.g.
vTotalTransactionsSet1 =
sum({<
[AuthorisationDate] .....
Let me cover fully, just one of the KPIs as a way of explanation - maybe you'll detect something that I am doing wrong in my implementation:
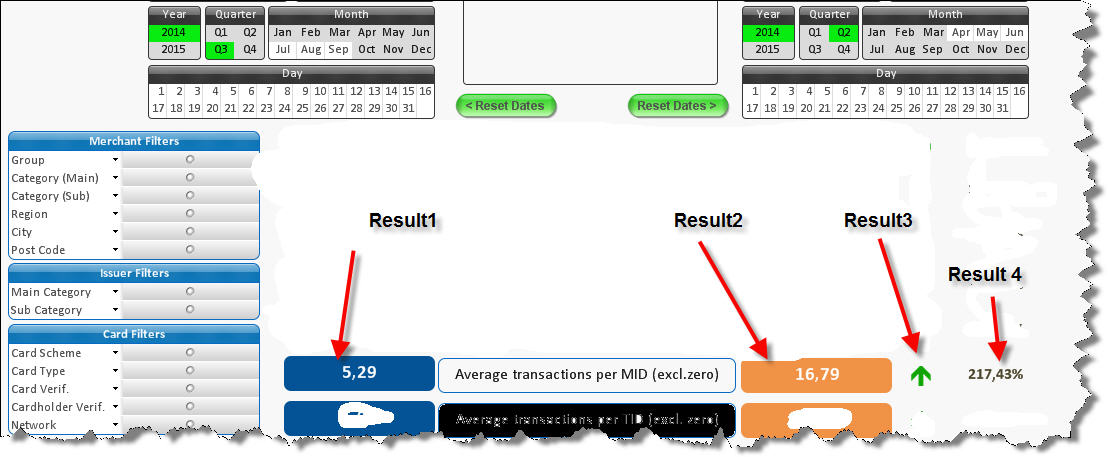
KPI: Average transactions per MID

Result1: (this is the result for date set Group1):
= num($(vTotalTransactionsSet1) / $(vTotalUniqueMIDsSet1), '#.##0,00')
where
vTotalTransactionsSet1 is defined as:
= sum({< [AuthorisationDate] = {'>=$(=Date(vStartDate1))<=$(=Date(vEndDate1))'},
[Authorisations Year] = [Group1]::[Authorisations Year],
[Authorisations Quarter] = [Group1]::[Authorisations Quarter],
[Authorisations Month] = [Group1]::[Authorisations Month],
[Authorisations Week] = [Group1]::[Authorisations Week],
[Authorisations Day] = [Group1]::[Authorisations Day],
[TerminalsID] = {'<> 00'},
[TransactionAmmount] = {'> 0'}
>} AuthorisationRec)
vTotalUniqueMIDsSet1 is defined as:
=count({<[AuthorisationDate] = {'>=$(=Date(vStartDate1))<=$(=Date(vEndDate1))'},
[Authorisations Year] = [Group1]::[Authorisations Year],
[Authorisations Quarter] = [Group1]::[Authorisations Quarter],
[Authorisations Month] = [Group1]::[Authorisations Month],
[Authorisations Week] = [Group1]::[Authorisations Week],
[Authorisations Day] = [Group1]::[Authorisations Day],
[TerminalsID] = {'<> 00'},
[TransactionAmmount] = {'> 0'}
>} distinct Authorisations_MerchantID)
Result2: This is almost identical to Result 1 just replacing [Group1] for [Group2] and the vStartDate1 and vEndDate1 with their equivalents: vStart2 and EndDate2
Result3: This is defined as:
= if($(vAverageTransactionsPerMID_Compare)= 0,'arrow-level-blue.png',
if($(vAverageTransactionsPerMID_Compare)= 1, 'arrow-down-red.png', 'arrow-up-green.png'))
where:
vAverageTransactionsPerMID_Compare is defined as:
= if(
($(vTotalTransactionsSet2) / $(vTotalUniqueMIDsSet2)) =
($(vTotalTransactionsSet1) / $(vTotalUniqueMIDsSet1)) ,0,
if(
($(vTotalTransactionsSet2) / $(vTotalUniqueMIDsSet2)) >
($(vTotalTransactionsSet1) / $(vTotalUniqueMIDsSet1)) ,2,1))
Result4:
=num(
((($(vTotalTransactionsSet2) / $(vTotalUniqueMIDsSet2))
-
($(vTotalTransactionsSet1) / $(vTotalUniqueMIDsSet1))
) /
($(vTotalTransactionsSet1) / $(vTotalUniqueMIDsSet1))
), '#.##0,00%')