Unlock a world of possibilities! Login now and discover the exclusive benefits awaiting you.
- Qlik Community
- :
- All Forums
- :
- QlikView App Dev
- :
- Chart type?
- Subscribe to RSS Feed
- Mark Topic as New
- Mark Topic as Read
- Float this Topic for Current User
- Bookmark
- Subscribe
- Mute
- Printer Friendly Page
- Mark as New
- Bookmark
- Subscribe
- Mute
- Subscribe to RSS Feed
- Permalink
- Report Inappropriate Content
Chart type?
Hi everyone... I'm a brand new QV user and I'm developing a new dashboard on my job. Could anyone help me? (I'm not finding too much information in portuguese...). Which chart type is this one in the end of this png (those "flat lines")? Thanks.
- Tags:
- chart
- Mark as New
- Bookmark
- Subscribe
- Mute
- Subscribe to RSS Feed
- Permalink
- Report Inappropriate Content
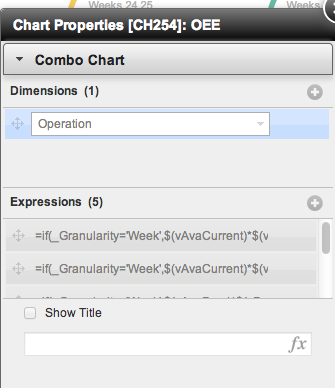
Are you referring to the charts in the 'By Machine OEE%' section? If you go to the app and on the object right click> properties, a box comes up saying they're 'combo charts'.
Looks like they gave them a horizontal orientation.
Hope that helps.
Matt
- Mark as New
- Bookmark
- Subscribe
- Mute
- Subscribe to RSS Feed
- Permalink
- Report Inappropriate Content
Yes, this is a combination chart and the orientation is horizontal. Then there are a few expressions, and they are set to use symbols like + (see image below as an example)
Thanks,
Kevin

- Mark as New
- Bookmark
- Subscribe
- Mute
- Subscribe to RSS Feed
- Permalink
- Report Inappropriate Content
Many thanks Matt! It helps very much.. I had just this png, didn't know it was developed by you... many thanks...
- Mark as New
- Bookmark
- Subscribe
- Mute
- Subscribe to RSS Feed
- Permalink
- Report Inappropriate Content
Thanks, Kevin!
- Mark as New
- Bookmark
- Subscribe
- Mute
- Subscribe to RSS Feed
- Permalink
- Report Inappropriate Content
I mean... I don't know if it's yours, but I don't know where to get this app too. Where can I find it?
Thanks.
- Mark as New
- Bookmark
- Subscribe
- Mute
- Subscribe to RSS Feed
- Permalink
- Report Inappropriate Content
It is an app on the Demo site here
- Mark as New
- Bookmark
- Subscribe
- Mute
- Subscribe to RSS Feed
- Permalink
- Report Inappropriate Content
Sorry to say I didn't make it;(
You can find qv demos here:
Qlik Demos: See QlikView in Action | Demo.Qlik.Com
The one you want is here:
Best,
Matt