Unlock a world of possibilities! Login now and discover the exclusive benefits awaiting you.
- Qlik Community
- :
- All Forums
- :
- QlikView App Dev
- :
- Chart X-axis range wise display
- Subscribe to RSS Feed
- Mark Topic as New
- Mark Topic as Read
- Float this Topic for Current User
- Bookmark
- Subscribe
- Mute
- Printer Friendly Page
- Mark as New
- Bookmark
- Subscribe
- Mute
- Subscribe to RSS Feed
- Permalink
- Report Inappropriate Content
Chart X-axis range wise display
Hi,
How can i display range in x-axis like(1-10,10-20,20-30......100) in Bar chart
Mydata is
SALESREPID ORDERId
1 100
2 101
1 102
3 103
1 104
2 105
in my data having total 2600 Orders
I want to display count(SalesRepID) in the above range wise
i am using =class(count(Total OrderID),50,'x')
it showing only one 2600<=x<2650
Please Help me,
Thank you.
- Tags:
- new_to_qlikview
Accepted Solutions
- Mark as New
- Bookmark
- Subscribe
- Mute
- Subscribe to RSS Feed
- Permalink
- Report Inappropriate Content
Data:
load
*,
replace(Class(ORDERS,10), '<= x <','-') as Range,
Class(ORDERS,10) as GroupRange
Resident Sales;
- Mark as New
- Bookmark
- Subscribe
- Mute
- Subscribe to RSS Feed
- Permalink
- Report Inappropriate Content
Use Class function. this will work for you
Sreeni
- Mark as New
- Bookmark
- Subscribe
- Mute
- Subscribe to RSS Feed
- Permalink
- Report Inappropriate Content
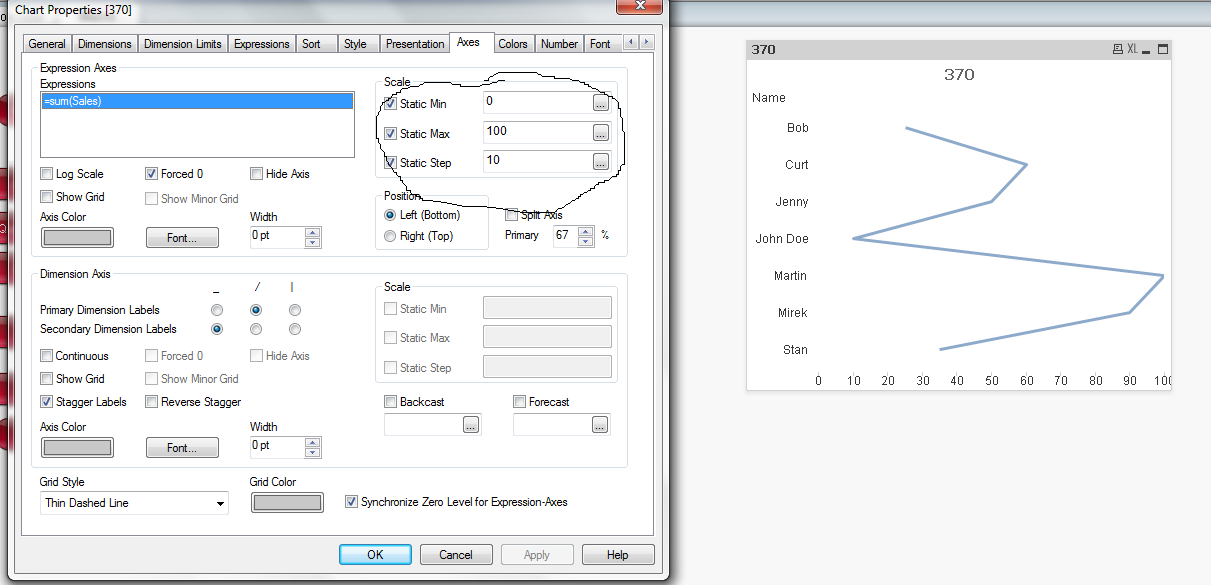
go to chart properties -> axis -> set minimum,maximum and step values
refer this attachment
- Mark as New
- Bookmark
- Subscribe
- Mute
- Subscribe to RSS Feed
- Permalink
- Report Inappropriate Content
i want to display range in x -axis
not 0,10,20,30
0-10,10-20,20-30
like this
- Mark as New
- Bookmark
- Subscribe
- Mute
- Subscribe to RSS Feed
- Permalink
- Report Inappropriate Content
have a look at this
- Mark as New
- Bookmark
- Subscribe
- Mute
- Subscribe to RSS Feed
- Permalink
- Report Inappropriate Content
Please send me class function expression ,i am using trail version
- Mark as New
- Bookmark
- Subscribe
- Mute
- Subscribe to RSS Feed
- Permalink
- Report Inappropriate Content
Data:
load
*,
replace(Class(ORDERS,10), '<= x <','-') as Range,
Class(ORDERS,10) as GroupRange
Resident Sales;
- Mark as New
- Bookmark
- Subscribe
- Mute
- Subscribe to RSS Feed
- Permalink
- Report Inappropriate Content
Thank you
Gowtham