Unlock a world of possibilities! Login now and discover the exclusive benefits awaiting you.
- Qlik Community
- :
- All Forums
- :
- QlikView App Dev
- :
- Re: Change rate - Couple of questions
- Subscribe to RSS Feed
- Mark Topic as New
- Mark Topic as Read
- Float this Topic for Current User
- Bookmark
- Subscribe
- Mute
- Printer Friendly Page
- Mark as New
- Bookmark
- Subscribe
- Mute
- Subscribe to RSS Feed
- Permalink
- Report Inappropriate Content
Change rate - Couple of questions
My Level of Qlikview = Beginner
I have data I need to display on a line graph to show changes over time.
I have many locations throughout the world and will incorporate later on.
Month is spelled out (January) or abbreviated (Jan) intermixed on the spread sheet.
I have a few questions and so far the topics that cover it are not spelling out how to do it, rather they are providing downloadable Qlikview files. I prefer to avoid downloading another persons file.
My test files are attached. I think I am properly showing the Monthly headcount compared to 1 year prior.
Question 1.) How do I make Qlikview automatically change month name January to Jan, state name Massachusetts to MA, day name Monday to Mon? This answer will probably correct the display issue that leads to question 2.
Question 2.) With no selections made, does the graph show total for all locations for the set dimensions?
- « Previous Replies
-
- 1
- 2
- Next Replies »
- Mark as New
- Bookmark
- Subscribe
- Mute
- Subscribe to RSS Feed
- Permalink
- Report Inappropriate Content
You will have to change the delimiter. try this:
AddressList:
Mapping Load * Inline [
LocationLong; Location
123 Abigail Avenue, Gene, MA 12345; 123 Abigail Ave
](delimiter is ';');
hope this helps
- Mark as New
- Bookmark
- Subscribe
- Mute
- Subscribe to RSS Feed
- Permalink
- Report Inappropriate Content
Awesome. Thank you!
- Mark as New
- Bookmark
- Subscribe
- Mute
- Subscribe to RSS Feed
- Permalink
- Report Inappropriate Content
New question. I know how its done for dates, but Im not sure how to do it for non-date entries.
Street number/name on the graphs Id like to organize in alphanumerical order. Using the SORT tab isn't doing what I would expect it to do.
On the Sort tab:
State= Ascending
Text= A->Z
Load order= unchecked.
Tried every option in sort. Nothing.
Is there something Im missing?
- Mark as New
- Bookmark
- Subscribe
- Mute
- Subscribe to RSS Feed
- Permalink
- Report Inappropriate Content
can u share a screenshot of expected output/sorting
- Mark as New
- Bookmark
- Subscribe
- Mute
- Subscribe to RSS Feed
- Permalink
- Report Inappropriate Content
I just want the sorting to be in order but the Sort tab is having no effect.
0,1,2,3,4...etc
a,b,c,d,e...etc
My other charts are sorting in numeric/alphabetic order. The only one that is not sorting in order is the chart with the address as Y dimension. Its all intermixed.
Attached is a mockup. It seems to be doing the same.
- Mark as New
- Bookmark
- Subscribe
- Mute
- Subscribe to RSS Feed
- Permalink
- Report Inappropriate Content
Are you expecting this?:
Sorting Expression:
subfield(Address,' ',1)
hope this helps
- Mark as New
- Bookmark
- Subscribe
- Mute
- Subscribe to RSS Feed
- Permalink
- Report Inappropriate Content
I would like it to sort the dimension in numeric order, then alphabetic.
123 Roman Ave
1 Joneston Row
18098 Call Park
456 One Two Ave
677 Home Dr
677 Home Drive
72 Awk Ct
8827 Card Row
987 West Key Loop
- Mark as New
- Bookmark
- Subscribe
- Mute
- Subscribe to RSS Feed
- Permalink
- Report Inappropriate Content
sorting expression:
left(subfield(Address,' ',1),1)
Ascending, Text A->Z
but "1 Joneston Row" will be either in first place or last place of the "1*****" Addresses!
- Mark as New
- Bookmark
- Subscribe
- Mute
- Subscribe to RSS Feed
- Permalink
- Report Inappropriate Content
That's fine. It being placed #2 in my list above was a mistake on my part.
Interestingly enough, this is the order after applying the above expression:
10898 call, 1 Joneston, 123 Roman, 456 One two, 677 Home, 72 awk, 8827 Card, 987 West.
I would think it would be 1 Jon, 10898, 123, etc. I can work with it like this, just find it interesting.
- Mark as New
- Bookmark
- Subscribe
- Mute
- Subscribe to RSS Feed
- Permalink
- Report Inappropriate Content
Ok, progress is good.
New question,
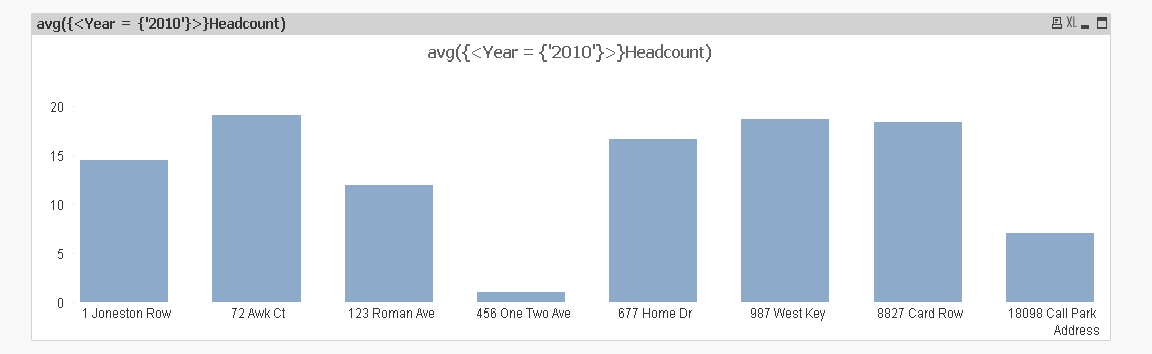
Using this expression it gives me the average for a location in the listed year when the dimension is Address.
avg({<Year = {'2010'}>}HeadCount)
If I select a month, it will average each location individually for only that month. Meaning if 123 has 8 employees in January, the average will be 8 for January.
If the month is not selected, it will take the average for the year.
Id like to move away from averages and display known values.
What expression can I use to show the most recent months value (December 2010 in this example) instead of an average that will adjust to show the selected month's totals?
The same attachment from above.
- « Previous Replies
-
- 1
- 2
- Next Replies »