Unlock a world of possibilities! Login now and discover the exclusive benefits awaiting you.
- Qlik Community
- :
- All Forums
- :
- QlikView App Dev
- :
- Calculated dimension for max date of each month
- Subscribe to RSS Feed
- Mark Topic as New
- Mark Topic as Read
- Float this Topic for Current User
- Bookmark
- Subscribe
- Mute
- Printer Friendly Page
- Mark as New
- Bookmark
- Subscribe
- Mute
- Subscribe to RSS Feed
- Permalink
- Report Inappropriate Content
Calculated dimension for max date of each month
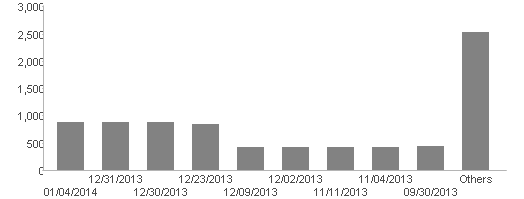
I'm trying to get a calculated dimension so that only one date for each month is shown in the dimension, how do I do this?
Based on the example above, I want my dimension values to be:
1/04/2014
12/31/2013
11/11/2013
9/30/2013
Any help would be greatly appreciated!
Accepted Solutions
- Mark as New
- Bookmark
- Subscribe
- Mute
- Subscribe to RSS Feed
- Permalink
- Report Inappropriate Content
You can achieve this by two ways...
Create one more field in your script...
Month(DateField) as Month
1) Using Calculated Dimension
Aggr(Max(DateField),Month)
Expression
SUM(Sales) //or whatever as per your data model
2) Using Set Analysis
Dimension
Date
TIck Suppress When Value is NULL
Expression
Aggr(SUM({<Date = {"=Aggr(Max(Date),Month)"}>}Sales),Month)
Performance of 2nd method is much better for Large DataBase...
- Mark as New
- Bookmark
- Subscribe
- Mute
- Subscribe to RSS Feed
- Permalink
- Report Inappropriate Content
Assuming that you have a Month field as well, you can try expression like: =Aggr(Max(Date), Month)
- Mark as New
- Bookmark
- Subscribe
- Mute
- Subscribe to RSS Feed
- Permalink
- Report Inappropriate Content
You can achieve this by two ways...
Create one more field in your script...
Month(DateField) as Month
1) Using Calculated Dimension
Aggr(Max(DateField),Month)
Expression
SUM(Sales) //or whatever as per your data model
2) Using Set Analysis
Dimension
Date
TIck Suppress When Value is NULL
Expression
Aggr(SUM({<Date = {"=Aggr(Max(Date),Month)"}>}Sales),Month)
Performance of 2nd method is much better for Large DataBase...
- Mark as New
- Bookmark
- Subscribe
- Mute
- Subscribe to RSS Feed
- Permalink
- Report Inappropriate Content
Thank you, Manish!
Your 2nd method using set analysis is exactly what I was trying to figure out. It does not sum all the values for each month, but rather just displays a single value that corresponds to the single date that is displayed, which is what I wanted.