Unlock a world of possibilities! Login now and discover the exclusive benefits awaiting you.
- Qlik Community
- :
- All Forums
- :
- QlikView App Dev
- :
- Bar-Line Graph with two expressions and two Dimens...
- Subscribe to RSS Feed
- Mark Topic as New
- Mark Topic as Read
- Float this Topic for Current User
- Bookmark
- Subscribe
- Mute
- Printer Friendly Page
- Mark as New
- Bookmark
- Subscribe
- Mute
- Subscribe to RSS Feed
- Permalink
- Report Inappropriate Content
Bar-Line Graph with two expressions and two Dimensions
Hi
I want to join this Two graphs in one. How can I do this?
All the data is in one table, and three fields. ie:
| CantidadEPCorregido | Sistema Origen Unido | EP |
|---|---|---|
| 23 | Consumo Real | EP1 |
| 35 | Consumo Real | EP2 |
| 40 | Tramo 1 | EP2 |
| ... | ... | ... |
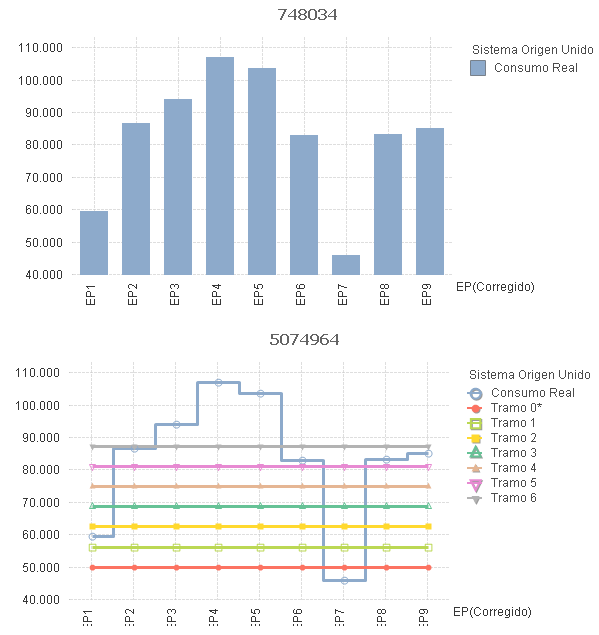
First Graph:
=Sum({¨<[Sistema Origen Unido]={'Consumo Real'}>} CantidadEPCorregido)
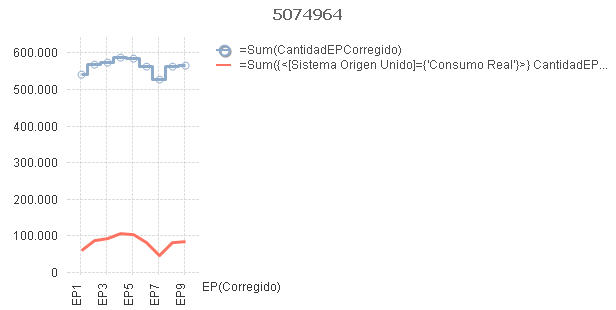
Second Graph:
=Sum(CantidadEPCorregido)
If I puth this Two Expressions in one graph, I get the third graph, which loses one of its dimensions.
¿Any idea how to solve this?
Thanks!!
- Mark as New
- Bookmark
- Subscribe
- Mute
- Subscribe to RSS Feed
- Permalink
- Report Inappropriate Content
Just to understand, your first graph shows a subset of the second, so why do you want to combine both expressions, since there will not be additional information, or am I missing something?
Which dimensions are you using in your charts? Could you upload a small sample QVW and your expected result (e.g. as excel file or sketch drawing?
- Mark as New
- Bookmark
- Subscribe
- Mute
- Subscribe to RSS Feed
- Permalink
- Report Inappropriate Content
Do you maybe want to show the line for Consumo Real regardless of selections in that field? But also lines for the other possible field values?
Then try your two dimensions and a single expression:
=Sum({¨<[Sistema Origen Unido] += {'Consumo Real'}>} CantidadEPCorregido)
- Mark as New
- Bookmark
- Subscribe
- Mute
- Subscribe to RSS Feed
- Permalink
- Report Inappropriate Content
You should try to split the Y axis - primary axis and secondary axis