Unlock a world of possibilities! Login now and discover the exclusive benefits awaiting you.
- Qlik Community
- :
- All Forums
- :
- QlikView App Dev
- :
- BAR CHART PLOT AREA COLOUR BASED ON EXPRESSION
- Subscribe to RSS Feed
- Mark Topic as New
- Mark Topic as Read
- Float this Topic for Current User
- Bookmark
- Subscribe
- Mute
- Printer Friendly Page
- Mark as New
- Bookmark
- Subscribe
- Mute
- Subscribe to RSS Feed
- Permalink
- Report Inappropriate Content
BAR CHART PLOT AREA COLOUR BASED ON EXPRESSION
Hi, does anyone know if its possible to change the plot area background colour based on an expression?
Basically i want the expression to do the following -
IF Y-AXIS > 0 THEN LIGHTGREEN PLOT AREA COLOUR
IF Y-AXIS < 0 THEN LIGHTRED PLOT AREA COLOUR
I was thinking of the following calulated expression:
=IF( YAXIS >0, LIGHTGREEN(), LIGHTRED())
also see my screenshots below
--------
- « Previous Replies
-
- 1
- 2
- Next Replies »
- Mark as New
- Bookmark
- Subscribe
- Mute
- Subscribe to RSS Feed
- Permalink
- Report Inappropriate Content
Hello,
I have exactly the same question, does anyone knows how to do it?
Thanks in advance!!
- Mark as New
- Bookmark
- Subscribe
- Mute
- Subscribe to RSS Feed
- Permalink
- Report Inappropriate Content
Hi
I hope I have understood your requirement correctly:
On your Chart Properties
- Go the Presentation tab
- Select Color [bottom left]
- Click color box under Background
- For Base Color select Calculated and enter you required expression
Best Regards, Bill
- Mark as New
- Bookmark
- Subscribe
- Mute
- Subscribe to RSS Feed
- Permalink
- Report Inappropriate Content
Goes to your Expression tab, click on '+' near your expression and put your expression
IF( column(1) >0, LIGHTGREEN(), LIGHTRED())
- Mark as New
- Bookmark
- Subscribe
- Mute
- Subscribe to RSS Feed
- Permalink
- Report Inappropriate Content
It works for bars but not for the background plot area. I think that the plot area color, even if calculated, is one per chart.
Regards,
Michael
- Mark as New
- Bookmark
- Subscribe
- Mute
- Subscribe to RSS Feed
- Permalink
- Report Inappropriate Content
I think Michael is right... It seems we cannot create a multiple color plot area background based on axis values...
- Mark as New
- Bookmark
- Subscribe
- Mute
- Subscribe to RSS Feed
- Permalink
- Report Inappropriate Content
Sorry, misunderstood the issue
- Mark as New
- Bookmark
- Subscribe
- Mute
- Subscribe to RSS Feed
- Permalink
- Report Inappropriate Content
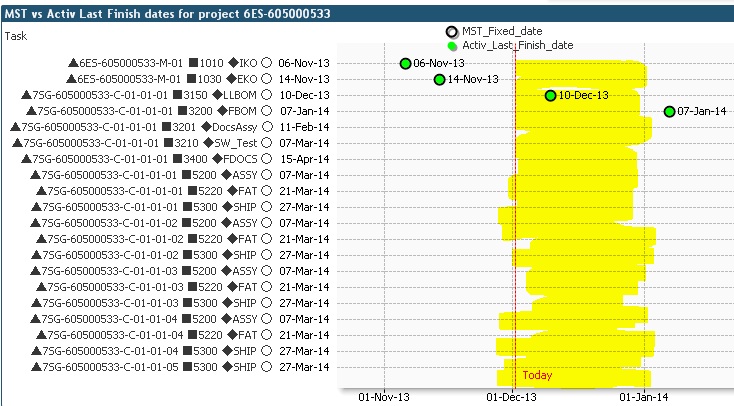
This is really a pitty. I have an scenario where I am using kind of a Gantt chart in qlikview with many project milestones spread over time and I set a reference line on the chart ( today() ) . It would be really helpful for me to be able to setup a calculated color for the plot area based on the today() ref line...so all space before today() goes grey ( all past activities ) , then a color band between today() and today()+10 would go yellow to alert me of all activities milestones coming due in the next 10 days.
Could someone confirm whether this is definitively not possible?
Thanks
- Mark as New
- Bookmark
- Subscribe
- Mute
- Subscribe to RSS Feed
- Permalink
- Report Inappropriate Content
Any chance someone found a fix for this? I am interested in having red/green/yellow background areas of a chart.
- Mark as New
- Bookmark
- Subscribe
- Mute
- Subscribe to RSS Feed
- Permalink
- Report Inappropriate Content
I have this exact same problem. Have you found a solution?
- « Previous Replies
-
- 1
- 2
- Next Replies »