Unlock a world of possibilities! Login now and discover the exclusive benefits awaiting you.
- Qlik Community
- :
- All Forums
- :
- QlikView App Dev
- :
- Averaging across different dimensions
- Subscribe to RSS Feed
- Mark Topic as New
- Mark Topic as Read
- Float this Topic for Current User
- Bookmark
- Subscribe
- Mute
- Printer Friendly Page
- Mark as New
- Bookmark
- Subscribe
- Mute
- Subscribe to RSS Feed
- Permalink
- Report Inappropriate Content
Averaging across different dimensions
Hi,
This is probably very basic but I am really stuck with the below and would appreciate anything here:
I have 2 tables:
Table 1 has these 3 headers: Salesperson, Date, Quantity
Table 2 has these 2 headers: Salesperson, Sales Boss
Salesperson is the primary key across tables.
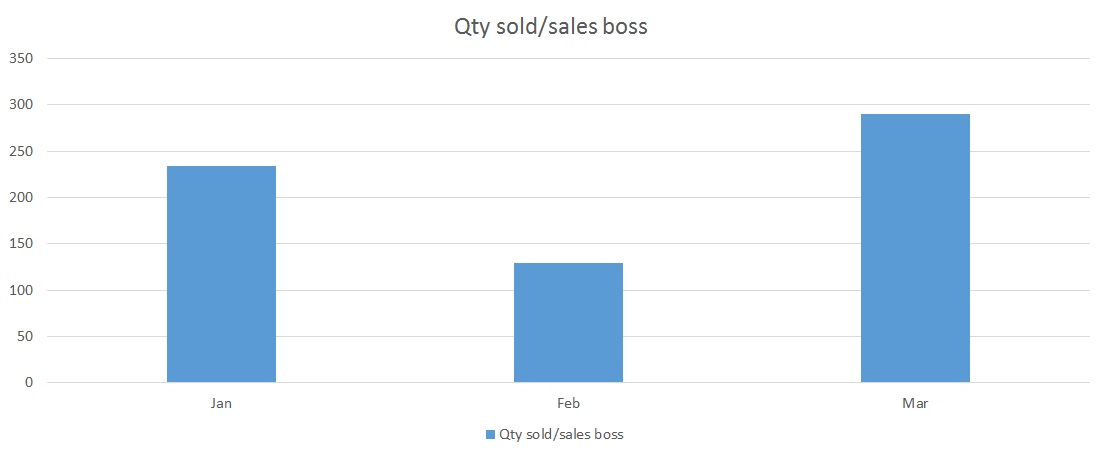
I want to create a bar chart with timeseries of average units sold per salesperson every month. This is a basic chart and is easy. Now I want to create a chart with timeseries of average units sold per sales boss every month. This is the part I am getting stuck as I cannot link across the different dimensions.
Ideally the chart should look like below: (Post this, I want to create another chart that has average units sold per sales boss per day). So need to create 2 charts here.