Unlock a world of possibilities! Login now and discover the exclusive benefits awaiting you.
- Qlik Community
- :
- All Forums
- :
- QlikView App Dev
- :
- Adding dynamic dimensions into straight table via ...
- Subscribe to RSS Feed
- Mark Topic as New
- Mark Topic as Read
- Float this Topic for Current User
- Bookmark
- Subscribe
- Mute
- Printer Friendly Page
- Mark as New
- Bookmark
- Subscribe
- Mute
- Subscribe to RSS Feed
- Permalink
- Report Inappropriate Content
Adding dynamic dimensions into straight table via script
i need to develope a report where the number of dimensions cannot be defined and does not have any maximum and user is not selecting any dimension. the number of dimentions are getting extracted from database and in every load the number changes. how to add dimenstions dynamically via script.
I need the calculated dimension below to be added to dimension in straight table via script as the number of dimensions varies in each load
= $(='[' & subfield(concat(QVD_Counts, ','), ',', $(=j+1) ) & ']');

- Mark as New
- Bookmark
- Subscribe
- Mute
- Subscribe to RSS Feed
- Permalink
- Report Inappropriate Content
You'd have to create the straight table programmatically using a macro. No, I won't write one for you. I'd ask what the purpose is. Possibly a simple export to a csv file that the consumer can open in excel will suffice instead.
talk is cheap, supply exceeds demand
- Mark as New
- Bookmark
- Subscribe
- Mute
- Subscribe to RSS Feed
- Permalink
- Report Inappropriate Content
I need to generate a table like below. It is an incremental load and will be run weekly. i have to upload the initial data and saved in QVD file. Then after each weekly run one column will get added to the table with the run date as its column label
- I am using triggersà OnPostReload to save the updated data in QVD file
sub Save_To_QVD
QVDFile= "C:\.....FILE.qvd"
set obj = ActiveDocument.GetSheetObject("CH06")
obj.ExportEx QVDFile,4
end sub
--------------------------
Count_of_Status:
load CS_Grouped_Status AS COS_Grouped_Status,
CS_Date as COS_Date,
COUNT(CS_ID) as COS_Count
Resident Current_Status
Group by CS_Grouped_Status, CS_Date;
LoadQVD_AppsInGI:
LOAD *
from
let k = NoOfFields('LoadQVD_AppsInGI');
let i = NoOfFields('LoadQVD_AppsInGI');
for i = 1 to $(i)
QVD_Counts_Table:
LOAD (FieldName($(i), 'LoadQVD_AppsInGI')) as QVD_Counts
AUTOGENERATE 1;
next i;
Calculated Dimension in straight table:
= $(='[' & subfield(concat(QVD_Counts, ','), ',', $(=j+3) ) & ']')
Status | 14-May | 21-May | 28-May |
Total 'Live' Apps | 32 | 33 | 38 |
Total Decom/Withdrawn Apps | 4 | 3 | 2 |
Grand Total Apps | 36 | 36 | 40 |
- Mark as New
- Bookmark
- Subscribe
- Mute
- Subscribe to RSS Feed
- Permalink
- Report Inappropriate Content
Use the CrossTable function to pivot the week columns to rows and create a week dimension. Then use a Pivot Table object that will have just two dimensions. No need for dynamically created Straight Table objects.
talk is cheap, supply exceeds demand
- Mark as New
- Bookmark
- Subscribe
- Mute
- Subscribe to RSS Feed
- Permalink
- Report Inappropriate Content
it looks like this also will not help me.
loading the new data has no issue, the problem is with joining the data retrieved from QVD file to the new data extrated from database in any table either Straight table or Pivot Table.
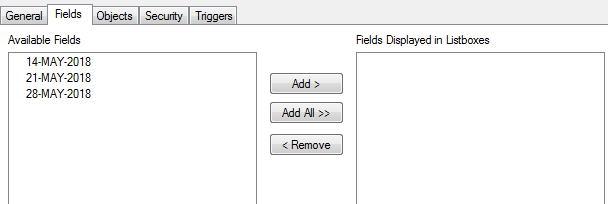
Issue: when i want to add the retrieved data to the table, it doesnt have a fixed name. the title of the fields are the dates as shown in the screenshot below
thats why I have written the script below to have the colunm names.... the other way is as you suggested to have weekdays
let i = NoOfFields('LoadQVD_AppsInGI');
for i = 1 to $(i)
QVD_Counts_Table:
LOAD (FieldName($(i), 'LoadQVD_AppsInGI')) as QVD_Counts
AUTOGENERATE 1;
next i;
for adding the fields to table i have written the code below
= $(='[' & subfield(concat(QVD_Counts, ','), ',', $(=j+3) ) & ']')
but for this i need to write a loop script in macro to add these columns.... but i dont know what are the syntax for writing these codes in macro
- Mark as New
- Bookmark
- Subscribe
- Mute
- Subscribe to RSS Feed
- Permalink
- Report Inappropriate Content
Hi Arezoo. I think you can do it with no macro. Just add a few calculated dimensions with expectation
= $(='[' & subfield(concat(QVD_Counts, ','), ',', 1 ) & ']')
= $(='[' & subfield(concat(QVD_Counts, ','), ',', 2 ) & ']')
= $(='[' & subfield(concat(QVD_Counts, ','), ',', 3 ) & ']')
= $(='[' & subfield(concat(QVD_Counts, ','), ',', 4 ) & ']')
............................................................
= $(='[' & subfield(concat(QVD_Counts, ','), ',', 25 ) & ']')
and make them conditional
1<=vNoOfFields
2<=vNoOfFields
3<=vNoOfFields
4<=vNoOfFields
........................
25<=vNoOfFields
- Mark as New
- Bookmark
- Subscribe
- Mute
- Subscribe to RSS Feed
- Permalink
- Report Inappropriate Content
thank you
i added Year and Month filters to control the growth
but i would like to know how i can write macro in such senarios,, appreciate if anyone can advise
- Mark as New
- Bookmark
- Subscribe
- Mute
- Subscribe to RSS Feed
- Permalink
- Report Inappropriate Content
Hi Arezoo, there is no need to use a macro in the above scenario, but...
try this sample and adjust it to the needs
Function AddDimensions
Dim vChart, vChartProperties, vDimensions, i
set vChart = ActiveDocument.GetSheetObject("CH01")
set vChartProperties = vChart.GetProperties
set vDimensions = vChartProperties.Dimensions
for i = 0 to vNoOfFields-1
vChart.AddDimension "=$(='[' & subfield(concat(QVD_Counts, ','), ',', $(=j+1) ) & ']')"
set vChartProperties = vChart.GetProperties : vChart.SetProperties vChartProperties
next
End Function
- Mark as New
- Bookmark
- Subscribe
- Mute
- Subscribe to RSS Feed
- Permalink
- Report Inappropriate Content
Thanks alot
- Mark as New
- Bookmark
- Subscribe
- Mute
- Subscribe to RSS Feed
- Permalink
- Report Inappropriate Content
What Gysbert is suggesting, and I second, is that you should not be loading the new month's data as a separate field. Use the crosstable prefix to generate two fields -- "Date" and "Amount" for every month. In doing it this way the same Pivot table will work for 1 month or 24 months.
-Rob