Unlock a world of possibilities! Login now and discover the exclusive benefits awaiting you.
- Qlik Community
- :
- All Forums
- :
- QlikView App Dev
- :
- Acumulative sum where you have so many dimensions
- Subscribe to RSS Feed
- Mark Topic as New
- Mark Topic as Read
- Float this Topic for Current User
- Bookmark
- Subscribe
- Mute
- Printer Friendly Page
- Mark as New
- Bookmark
- Subscribe
- Mute
- Subscribe to RSS Feed
- Permalink
- Report Inappropriate Content
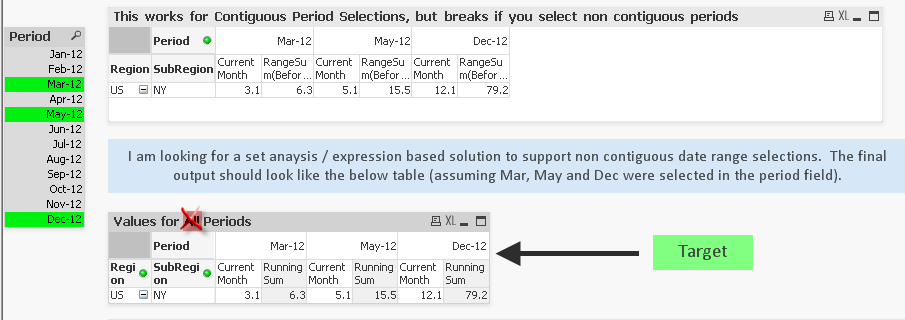
Acumulative sum where you have so many dimensions
I'm trying to get value like the attached QVW in a pivot table. But my data is very large and I do have many dimensions (more than 15)
How do you think the best practice to achieve this?
- « Previous Replies
-
- 1
- 2
- Next Replies »
Accepted Solutions
- Mark as New
- Bookmark
- Subscribe
- Mute
- Subscribe to RSS Feed
- Permalink
- Report Inappropriate Content
You can use set analysis in the Avg(1) field to restrict to your date range
RangeSum(Before( Count({<FLAG={'INV'},AssetStatusID={'REP','INV'},DATEPERIOD=, Year, Month}>} AssetModelKey), 0, ColumnNo())) * Avg({<DATEPERIOD = {">=$(=Date(vDateFrom2, 'M/D/YYYY'))<=$(=Date(vDateTo2, 'M/D/YYYY'))"}>} 1)
- Mark as New
- Bookmark
- Subscribe
- Mute
- Subscribe to RSS Feed
- Permalink
- Report Inappropriate Content
I believe what you done is optimized one only because in model it storing and creating only one table that mean we are not creating Link table and management / business logic tables ...
- Mark as New
- Bookmark
- Subscribe
- Mute
- Subscribe to RSS Feed
- Permalink
- Report Inappropriate Content
No. I am trying to create one. But when I use the same method like the QVW I attached, the script's load is taking so much time (more than 30 mins).
In that QVW there are only 2 dimension, so I probably can use this on the script:
if(RowNo()=1 or Region&SubRegion<>previous(Region&SubRegion),Value,Value+peek(CumVal)) as CumVal
What if I have so many dimensions?
- Mark as New
- Bookmark
- Subscribe
- Mute
- Subscribe to RSS Feed
- Permalink
- Report Inappropriate Content
Even thought, If you have more than 10 fields it may useful
Load *, AutoNumber(Region&SubRegion&...&...&....) as Key
Then this?
if(RowNo()=1 or Key<>previous(Key),Value,Value+peek('CumVal')) as CumVal
- Mark as New
- Bookmark
- Subscribe
- Mute
- Subscribe to RSS Feed
- Permalink
- Report Inappropriate Content
Is this what you are looking to get?
Expression
RangeSum(Before(SUM(DISTINCT {<Period>} Value), 0, ColumnNo())) * Avg(1)
- Mark as New
- Bookmark
- Subscribe
- Mute
- Subscribe to RSS Feed
- Permalink
- Report Inappropriate Content
hi
may i ask why you use *avg(1) in the expression? thanks
- Mark as New
- Bookmark
- Subscribe
- Mute
- Subscribe to RSS Feed
- Permalink
- Report Inappropriate Content
I have used {<Period>} in set analysis which will ignore selection in Period and will show all periods even if you select 1 or multiple of them.... Avg(1) will equal to 1 for the selected period and will equal to 0 for periods which you have no selected forcing the expression to be 0 for non selected period... This is basically an alternative to writing an if statement like this
If(Period, RangeSum(Before(SUM(DISTINCT {<Period>} Value), 0, ColumnNo())))
- Mark as New
- Bookmark
- Subscribe
- Mute
- Subscribe to RSS Feed
- Permalink
- Report Inappropriate Content
I used that expression to do so in my real data.
If I select all the period where the data exist, it will give me the correct values.
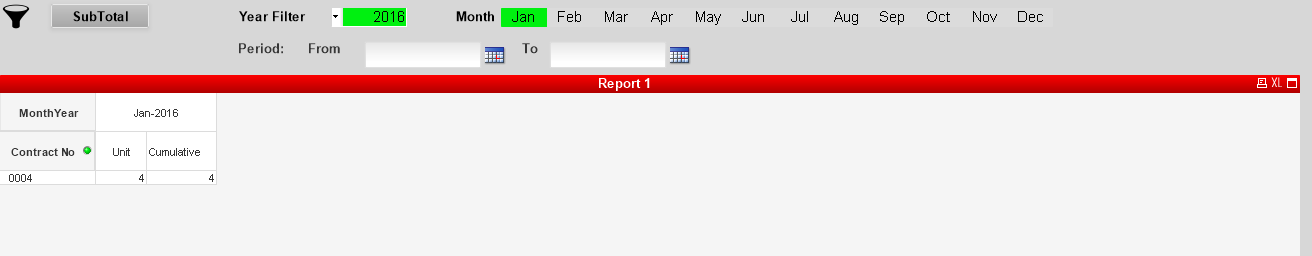
But when I select only one or some period (not all), the cummulative sum went wrong.
Here is if I select all period where data exist:
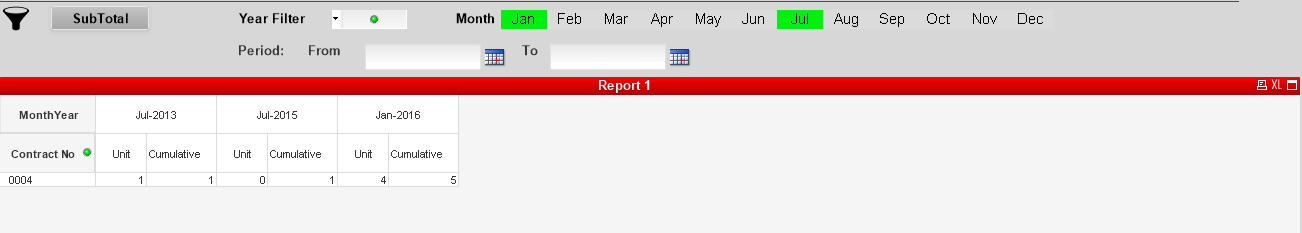
If I select only Jan, the cumulative must be 5
Expression i use:
RangeSum(Before( Count({<FLAG={'INV'},AssetStatusID={'REP','INV'},DATEPERIOD=}>} AssetModelKey), 0, ColumnNo())) * Avg(1)
- Mark as New
- Bookmark
- Subscribe
- Mute
- Subscribe to RSS Feed
- Permalink
- Report Inappropriate Content
Try this
RangeSum(Before( Count({<FLAG={'INV'},AssetStatusID={'REP','INV'},DATEPERIOD=, Year, Month}>} AssetModelKey), 0, ColumnNo())) * Avg(1)
I added Year and Month in set analysis because you were making selection there... for this to work, you will need to add all your date and time selection field in your set analysis
- Mark as New
- Bookmark
- Subscribe
- Mute
- Subscribe to RSS Feed
- Permalink
- Report Inappropriate Content
It works! Thanks 
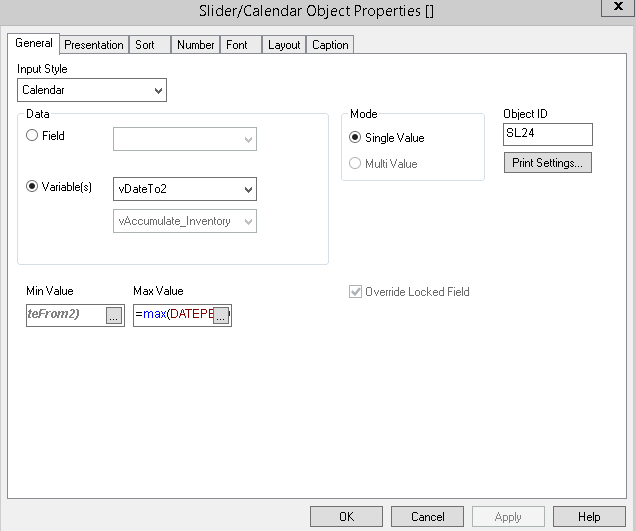
But I have 1 more problem, when I only select the acumulative value and use period from to (Calendar Object) I get the result wrong. All the date period is showed, even though i didnt choose it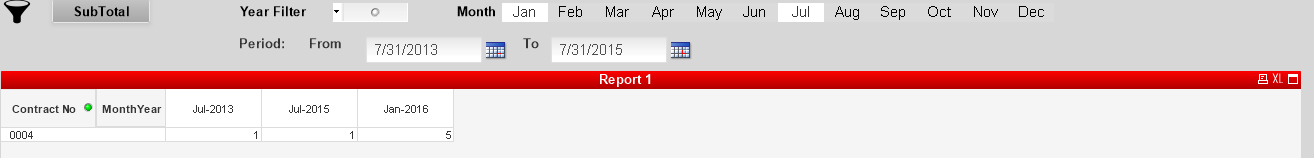
Date from: min value: min(DATEPERIOD), Max value = max(DATEPERIOD)
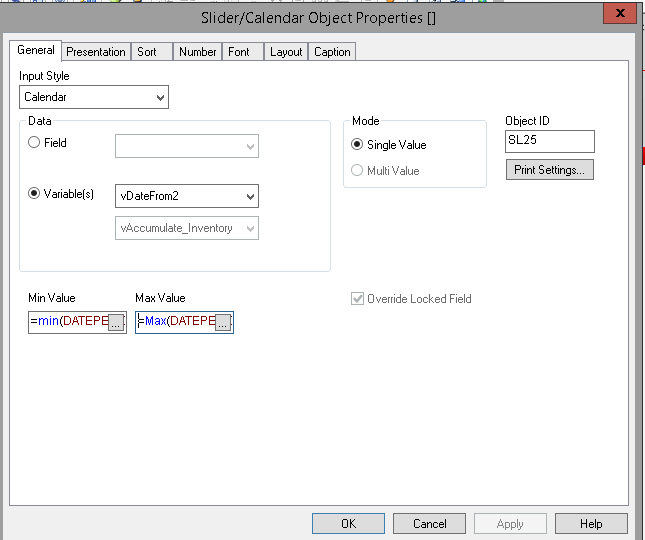
Date TO: min value: vDateFrom2, Max value =max(DATEPERIOD)
- « Previous Replies
-
- 1
- 2
- Next Replies »