Unlock a world of possibilities! Login now and discover the exclusive benefits awaiting you.
- Qlik Community
- :
- All Forums
- :
- QlikView App Dev
- :
- 2-dimension bar chart with labels of both dimensio...
- Subscribe to RSS Feed
- Mark Topic as New
- Mark Topic as Read
- Float this Topic for Current User
- Bookmark
- Subscribe
- Mute
- Printer Friendly Page
- Mark as New
- Bookmark
- Subscribe
- Mute
- Subscribe to RSS Feed
- Permalink
- Report Inappropriate Content
2-dimension bar chart with labels of both dimensions displayed at x-axis
I have a chart with 2 dimensions (Year 2012- 2015, school A - C) and I create a bar chart (Chart 1)
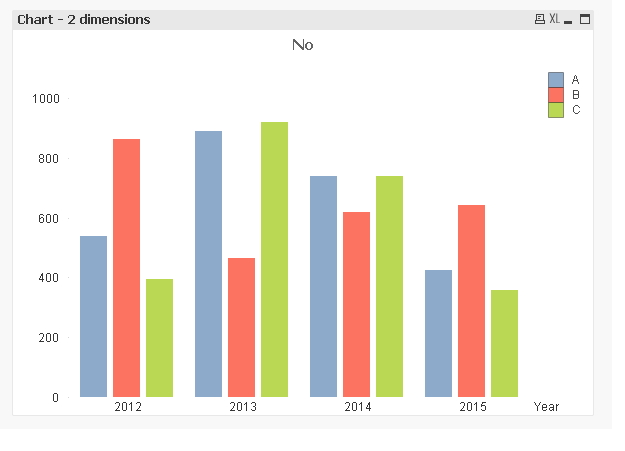
However only the label of one dimension (i.e. 2012, 2013, ...) is shown at x-axis and what I want is to show BOTH dimensions' labels at x-axis
I did manage to work around this problem by adding a dummy dimension (Chart 2), but the con is it doesn't show different colours for different bars (which is expected as the dummy dimension has one value only).
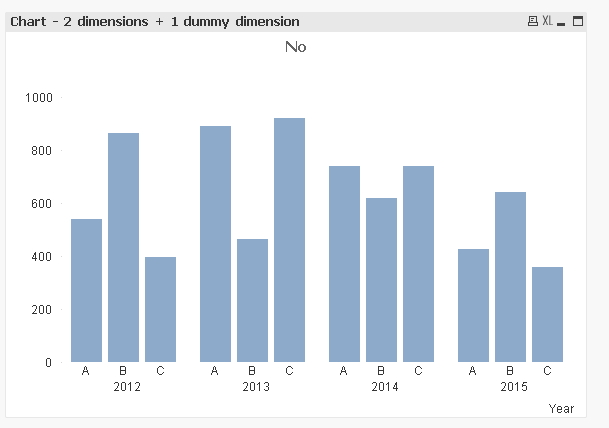
Possibly I miss some obvious settings in chart 1, does anyone has any idea on how to make both dimensions' labels displaying on same x-axis? Many thanks.
Accepted Solutions
- Mark as New
- Bookmark
- Subscribe
- Mute
- Subscribe to RSS Feed
- Permalink
- Report Inappropriate Content
Hi,
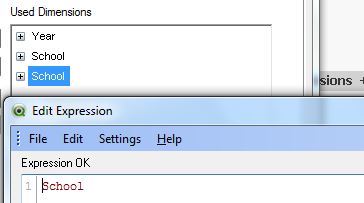
Instead of "Dummy Dimension", Put the Same Field Name, Here it is "School"
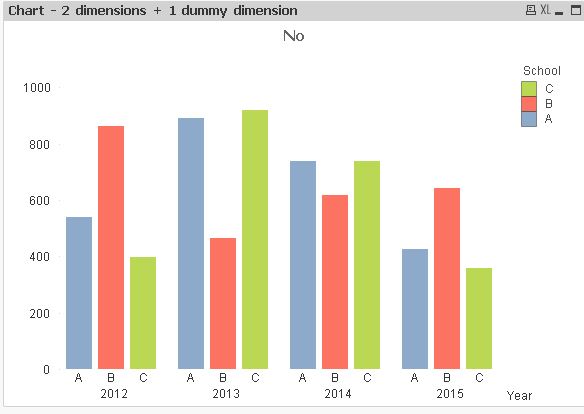
The Chart will look like below..
- Mark as New
- Bookmark
- Subscribe
- Mute
- Subscribe to RSS Feed
- Permalink
- Report Inappropriate Content
Hi,
Instead of "Dummy Dimension", Put the Same Field Name, Here it is "School"
The Chart will look like below..
- Mark as New
- Bookmark
- Subscribe
- Mute
- Subscribe to RSS Feed
- Permalink
- Report Inappropriate Content
A simple solution! Thanks!