Unlock a world of possibilities! Login now and discover the exclusive benefits awaiting you.
- Qlik Community
- :
- All Forums
- :
- QlikView App Dev
- :
- 1 is to Many Chart Issue when using Distinct on ex...
- Subscribe to RSS Feed
- Mark Topic as New
- Mark Topic as Read
- Float this Topic for Current User
- Bookmark
- Subscribe
- Mute
- Printer Friendly Page
- Mark as New
- Bookmark
- Subscribe
- Mute
- Subscribe to RSS Feed
- Permalink
- Report Inappropriate Content
1 is to Many Chart Issue when using Distinct on expression
Hi Qv Community,
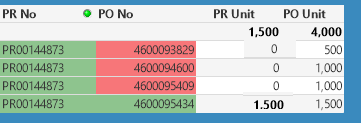
I used an aggregation and distinct on an variable which give me the right figures I wanted but when I plot it on the table as an expression
with the document numbers, it shows a misleading result. please see result below.
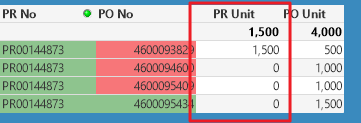
The Correct PR Unit figure is 1500, I want my output to be like the one below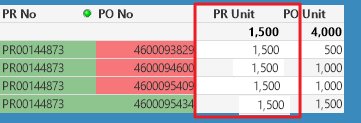
Expression is : Sum(aggr(Sum(Distinct [PR Unit]), [PR No], [Item Number]))
Thanks!
Regards,
Charles
- Mark as New
- Bookmark
- Subscribe
- Mute
- Subscribe to RSS Feed
- Permalink
- Report Inappropriate Content
what are the dimensions using in your chart?
try this
aggr(Sum(Distinct [PR Unit]), [PR No], [PO No])
- Mark as New
- Bookmark
- Subscribe
- Mute
- Subscribe to RSS Feed
- Permalink
- Report Inappropriate Content
Try:
Sum(aggr(NoDistinct Sum(Distinct [PR Unit]), [PR No], [Item Number]))
- Mark as New
- Bookmark
- Subscribe
- Mute
- Subscribe to RSS Feed
- Permalink
- Report Inappropriate Content
Perhaps you need something like:
Sum(Distinct TOTAL [PR No])
or
Sum(Distinct TOTAL<[PO No]> [PR No])
If you need the Distinct to apply at a lower level, then you can use Aggr(), but you need to include ALL the chart dimensions as dimensions for your Aggr(), in addition to any dimensions the expression requires. But this can affect the result for distinct if you use too many dimensions. You might need something like this to fix that:
Sum(TOTAL<[PR No]> Aggr(Sum(Distinct [PR Unit]), [PR No], [Item Number], [PO No]))
(assuming the values in the PR Unit column are totals for a PR No)
- Mark as New
- Bookmark
- Subscribe
- Mute
- Subscribe to RSS Feed
- Permalink
- Report Inappropriate Content
Would you be able to provide application.
- Mark as New
- Bookmark
- Subscribe
- Mute
- Subscribe to RSS Feed
- Permalink
- Report Inappropriate Content
I use dynamic dimensions so a lot of field can be added as dimension on my chart
- Mark as New
- Bookmark
- Subscribe
- Mute
- Subscribe to RSS Feed
- Permalink
- Report Inappropriate Content
the red rows indicates that the Document is deleted, can I have this output instead?