Unlock a world of possibilities! Login now and discover the exclusive benefits awaiting you.
- Qlik Community
- :
- Forums
- :
- Analytics
- :
- New to Qlik Analytics
- :
- Waterfallchart with time dimension, privious month...
- Subscribe to RSS Feed
- Mark Topic as New
- Mark Topic as Read
- Float this Topic for Current User
- Bookmark
- Subscribe
- Mute
- Printer Friendly Page
- Mark as New
- Bookmark
- Subscribe
- Mute
- Subscribe to RSS Feed
- Permalink
- Report Inappropriate Content
Waterfallchart with time dimension, privious month as starting point
Hello,
I try to create waterfall chart with a time dimesion based dynamic waterfall chart.
How the waterfall chart should look like and work:
Example of waterfall chart I already use in Excel:
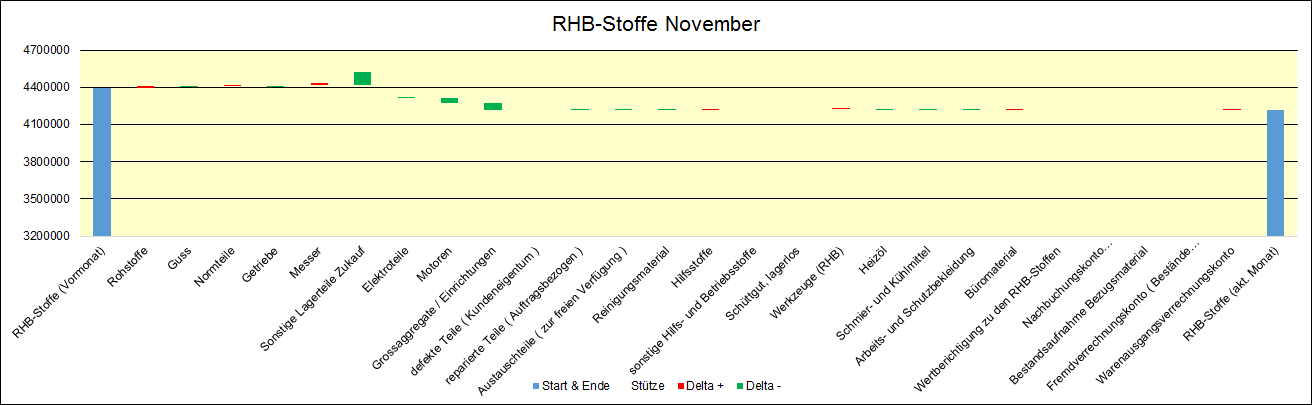
I want to transfer this waterfall chart to Qlik Sense with the same look and functions. I can chose the measures of the year and the moth I want to analyse. I would like to have the same possiblities in Qlik Sense.
The first bar should show the cumulated measures of the last month (in the exampel October) and it should be also the starting point. The last bar should be the cumulated measure of the month. Between these two bars I want to see the changes of the month.
I have already done in Qlik Sense:
I created the loading script based on the dynamic waterfall chart I found in this community. I took the same structure and I just used my dates. I can load the script and it doesnt show any error.
After that i used the formula of dynamic waterfall chart in the diagramm chart. But it doesnt work. My main issue is I don´t understand the syntax of Qlik Sense, especially the diagramm function. I don´t get it to work
I hope my explanation was clear enough to understand my problem.
Thanks for every help I get!