Unlock a world of possibilities! Login now and discover the exclusive benefits awaiting you.
- Qlik Community
- :
- All Forums
- :
- Deployment & Management
- :
- Telemetry CreateSessionObject Process time increas...
- Subscribe to RSS Feed
- Mark Topic as New
- Mark Topic as Read
- Float this Topic for Current User
- Bookmark
- Subscribe
- Mute
- Printer Friendly Page
- Mark as New
- Bookmark
- Subscribe
- Mute
- Subscribe to RSS Feed
- Permalink
- Report Inappropriate Content
Telemetry CreateSessionObject Process time increased after version upgrade
Hi!
Recently we made an upgrade from Aug 2021 to Nov 2022 patch 3.
We have been running Telemetry data collection for a long time, so when we after the upgrade got complaints that the performance has degraded we could investigate using the Telemetry data.
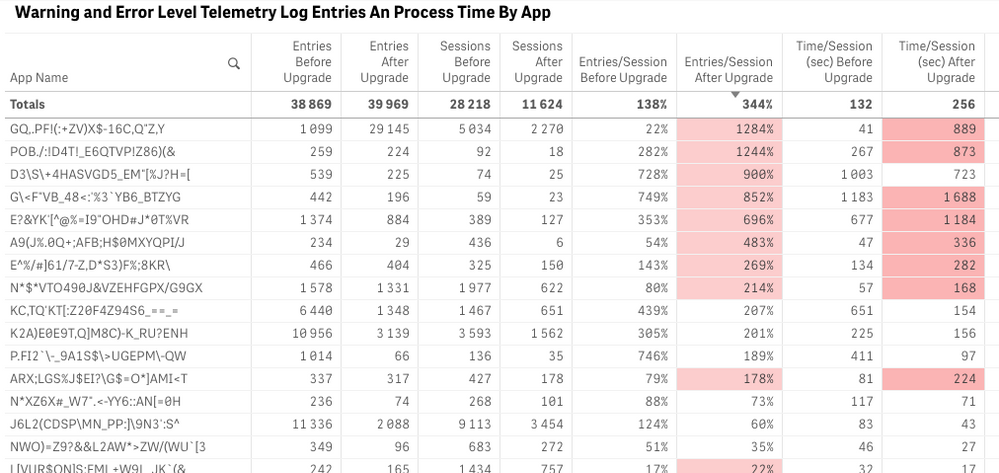
When comparing logged Process time data per app before and after the upgrade we see that some of our most used (and largest) apps has better performance after the upgrade, while some has poorer performance, that is longer process time.
In particular 2-3 apps stands out with much degraded performance, one of them the one users complained about most.
That app is also the one that has the largest increase in Telemetry loggings/session before-after upgrade.
Looking into the methods logged we can see that the method that is the main contributor to the problems is Doc::CreateSessionObject, which literally explodes from an average of 36 seconds per session to an average of 456 seconds (7.5 minutes!) per session.
The app is fairly large, but not the largest in our environment. It has a very simple datamodel, basically one table with 150 M records. The app also has section access (but we have other apps that also have section access).
So, can anyone advice on what have changed in the engine between Aug 2021 and Nov 2022 that makes Doc::CreateSessionObject be much more process intense, and what we can do to resolve this?
- Tags:
- performance
- telemetry
- Mark as New
- Bookmark
- Subscribe
- Mute
- Subscribe to RSS Feed
- Permalink
- Report Inappropriate Content
Hello @gandalfgray
For this one "You shall pass!" 😄
I think what you are seeing in the first SS shows you a sum of the values on the second SS. Have you checked if this is what is happening? The values look very similar.
Please let me know.
Regards,
Eduardo Monteiro
- Mark as New
- Bookmark
- Subscribe
- Mute
- Subscribe to RSS Feed
- Permalink
- Report Inappropriate Content
Well, the first screenshot shows the sum of warning/error telemetry messages before and after upgrade per app.
And, the second screenshot shows the sum of warning/error telemetry messages before and after upgrade per app and method and I have filtered on the first app in the first screenshot,
so yes the total in table two is what is shown in the first line of table one.
But the question was not about comparing the two tables, it was about why a newer Qlik Sense version has a much higher frequency of certain Method calls
- Mark as New
- Bookmark
- Subscribe
- Mute
- Subscribe to RSS Feed
- Permalink
- Report Inappropriate Content
Hi @gandalfgray
Are we saying that there are more sessions after the upgrade ? More uses accessing the dashboard?
How is the overall performance at the time when the users complain?
Are those numbers average? Or are we saying that regardless time it in general consumes more resources?
By any chance do you have dev servers with QS Nov 2022 and Aug 2021 where you can test that specific app? Like stopping the engine to release resources, opening the app in both and make same selections, open same sheet and compare?
What are the affected objects, QS native objects or third party extensions?
Hope it helps.

