Unlock a world of possibilities! Login now and discover the exclusive benefits awaiting you.
- Qlik Community
- :
- Forums
- :
- Analytics
- :
- App Development
- :
- IF (True) Do not count x
- Subscribe to RSS Feed
- Mark Topic as New
- Mark Topic as Read
- Float this Topic for Current User
- Bookmark
- Subscribe
- Mute
- Printer Friendly Page
- Mark as New
- Bookmark
- Subscribe
- Mute
- Subscribe to RSS Feed
- Permalink
- Report Inappropriate Content
IF (True) Do not count x
Hi,
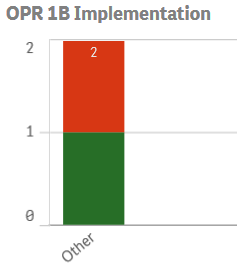
I am trying to calculate in a bar chart the implementation of scores with this methodology:
Dimension:
=if([Movement Type]='Termination Voluntary' or 'Termination Involuntary', 'Implemented', 'Not Implemented')
Measure:
Count(distinct{<[OPR 2018]={'1B'}>}"Global ID")
This works fine, however what i would like is, that once a person has an implemented status, I do not want the graph to calculate the Not implemented status.
For example as shown in the below graph, the bar represents only 1 person. This person has an implemented status and not implemented due to multiple Movement types. But as the person already has been implemented, I do not want the bar chart to show to not implemented count. Is this possible?
- « Previous Replies
-
- 1
- 2
- Next Replies »
Accepted Solutions
- Mark as New
- Bookmark
- Subscribe
- Mute
- Subscribe to RSS Feed
- Permalink
- Report Inappropriate Content
You can look at p() and e() here
P() & E() and where do you use them?
and also here
p() and e() function in Set Analysis #Part 30 (Qlikview Tutorial) - YouTube
Change your expression to this for selection in Name
Count(DISTINCT {<[OPR 2018] = {'1B'}, Name *= p({<[Movement Type] = {'Termination Voluntary', 'Termination Involuntary'}>})>} "Global ID")
Count(DISTINCT {<[OPR 2018] = {'1B'}, Name *= e({<[Movement Type] = {'Termination Voluntary', 'Termination Involuntary'}>})>} "Global ID")
Selection in Function should work without any issues... what happens when you select a function?
- Mark as New
- Bookmark
- Subscribe
- Mute
- Subscribe to RSS Feed
- Permalink
- Report Inappropriate Content
Are you using more than one dimension in this chart?
- Mark as New
- Bookmark
- Subscribe
- Mute
- Subscribe to RSS Feed
- Permalink
- Report Inappropriate Content
Yes, another dimension is Function.
- Mark as New
- Bookmark
- Subscribe
- Mute
- Subscribe to RSS Feed
- Permalink
- Report Inappropriate Content
So, for each Function... you want to see a single person in either Implemented or Not Implemented. If they are in Implemented, then they should not be counted in Not Implemented.
- Mark as New
- Bookmark
- Subscribe
- Mute
- Subscribe to RSS Feed
- Permalink
- Report Inappropriate Content
Correct
| Name | Cycle | Score 2017 | Score 2018 | Movement | Implemented |
|---|---|---|---|---|---|
| Jack | 2018-2019 | 3A | 1B | Termination | Yes |
| Jack | 2017-2018 | 3A | 1B | Promotion | No |
| Jack | 2017-2018 | 3A | 1B | Promotion | No |
If this would be my data, i only want the chart to count the implemented move.
As the not implemented moves are not applicable after an implementation has been performed.
- Mark as New
- Bookmark
- Subscribe
- Mute
- Subscribe to RSS Feed
- Permalink
- Report Inappropriate Content
May be create this using 1 dimension and 2 expressions like this
Dimension
Function
Expression for Implemented
Count(DISTINCT {<[OPR 2018] = {'1B'}, Name = p({<[Movement Type] = {'Termination Voluntary', 'Termination Involuntary'}>})>} "Global ID")
Expression for not implemented
Count(DISTINCT {<[OPR 2018] = {'1B'}, Name = e({<[Movement Type] = {'Termination Voluntary', 'Termination Involuntary'}>})>} "Global ID")
- Mark as New
- Bookmark
- Subscribe
- Mute
- Subscribe to RSS Feed
- Permalink
- Report Inappropriate Content
Thanks,
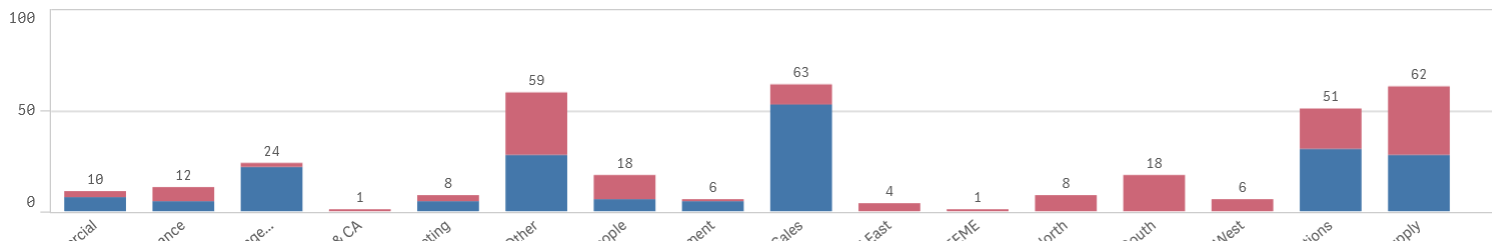
It is partially working, the only issue now is that when I apply a filter this happens:
Unfiltered:
Filtered:
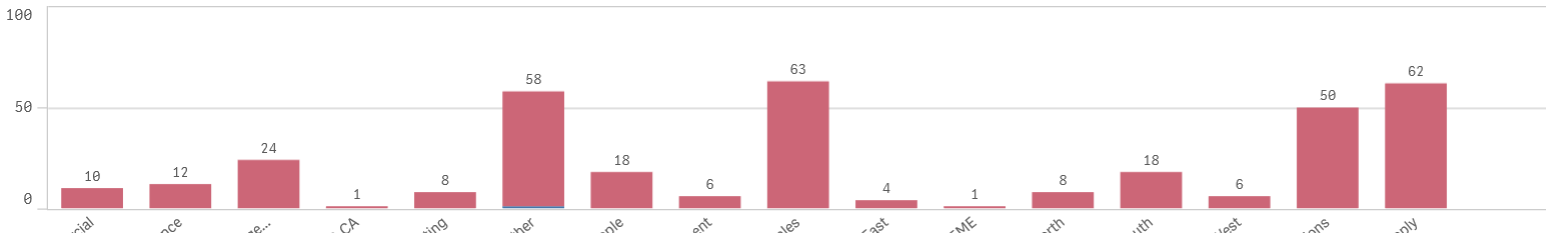
Where as before when I applied a filter it would only show the function associated with it.
So now when I filter for the function Sales, I only want to see sales in the graph, when I filter for a person that is implemented, I only want to see the implemented bar, not the not-implemented.
Is this possible?
Could you maybe also explain what the red "P" and "E" do? I am very curious what you did here.
Thanks a lot Sunny!
- Mark as New
- Bookmark
- Subscribe
- Mute
- Subscribe to RSS Feed
- Permalink
- Report Inappropriate Content
You can look at p() and e() here
P() & E() and where do you use them?
and also here
p() and e() function in Set Analysis #Part 30 (Qlikview Tutorial) - YouTube
Change your expression to this for selection in Name
Count(DISTINCT {<[OPR 2018] = {'1B'}, Name *= p({<[Movement Type] = {'Termination Voluntary', 'Termination Involuntary'}>})>} "Global ID")
Count(DISTINCT {<[OPR 2018] = {'1B'}, Name *= e({<[Movement Type] = {'Termination Voluntary', 'Termination Involuntary'}>})>} "Global ID")
Selection in Function should work without any issues... what happens when you select a function?
- Mark as New
- Bookmark
- Subscribe
- Mute
- Subscribe to RSS Feed
- Permalink
- Report Inappropriate Content
Amazing,
Thank you very much.
- Mark as New
- Bookmark
- Subscribe
- Mute
- Subscribe to RSS Feed
- Permalink
- Report Inappropriate Content
Hi Sunny,
One more question,
I have 1 field called cycle which represents the different cycles in which a movement has taken place. How should I adapt the code if I want the expression to look for a movement in the cycle '2018-2019'
The field "Cycle" containing the likes of;
2016-2017, 2017-2018, 2018-2019
- « Previous Replies
-
- 1
- 2
- Next Replies »