Unlock a world of possibilities! Login now and discover the exclusive benefits awaiting you.
- Qlik Community
- :
- Forums
- :
- Analytics
- :
- App Development
- :
- Re: Dynamic axis Min/Max range in Qliksense combo ...
Options
- Subscribe to RSS Feed
- Mark Topic as New
- Mark Topic as Read
- Float this Topic for Current User
- Bookmark
- Subscribe
- Mute
- Printer Friendly Page
Turn on suggestions
Auto-suggest helps you quickly narrow down your search results by suggesting possible matches as you type.
Showing results for
Contributor
2021-09-20
01:30 AM
- Mark as New
- Bookmark
- Subscribe
- Mute
- Subscribe to RSS Feed
- Permalink
- Report Inappropriate Content
Dynamic axis Min/Max range in Qliksense combo chart
I need to show the Y axis range from the minimum value of my chart and its should be dynamic.
For Ex(minimum 57 or 56) the Y axis range should start from this.
thanks in advance.
1,492 Views
1 Reply
Partner - Master III
2021-09-20
02:30 AM
- Mark as New
- Bookmark
- Subscribe
- Mute
- Subscribe to RSS Feed
- Permalink
- Report Inappropriate Content
Hi,
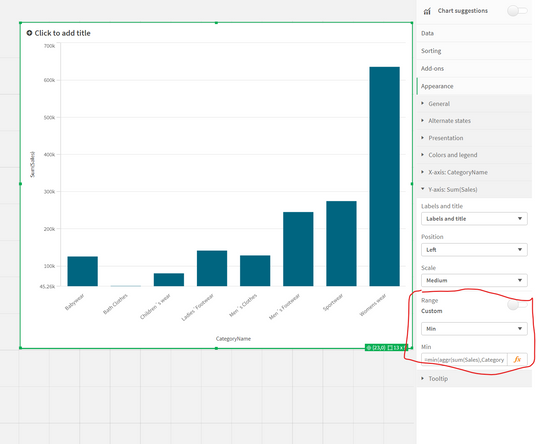
In the Y-axis settings, you can change the range setting from Auto to Custom.
Then you can use this expression for calculating the minimum value :
min(aggr(Sum(Sales),YearMonth))
* Please note you'll need to replace the names of the fields with your real ones.
Community Browser

