Unlock a world of possibilities! Login now and discover the exclusive benefits awaiting you.
- Qlik Community
- :
- Forums
- :
- Analytics
- :
- App Development
- :
- Re: Color logic in QlikSense
- Subscribe to RSS Feed
- Mark Topic as New
- Mark Topic as Read
- Float this Topic for Current User
- Bookmark
- Subscribe
- Mute
- Printer Friendly Page
- Mark as New
- Bookmark
- Subscribe
- Mute
- Subscribe to RSS Feed
- Permalink
- Report Inappropriate Content
Color logic in QlikSense
Hi All,
We have supervisors and mechanics in a table, I have written mechanics text color logic(Green,Amber,Red) based on my expression. Now I have to write a color logic on top of the supervisor based mechanic color, suppose if one supervisor under having 5 mechanics , among this five mechanics any one mechanic is having red color the supervisor name text color as red and any one mechanics is amber the supervisor text color display amber, all are green it should green. like below..

Any Help..
Accepted Solutions
- Mark as New
- Bookmark
- Subscribe
- Mute
- Subscribe to RSS Feed
- Permalink
- Report Inappropriate Content
Hello,
I have for you an example that might help you achieve the use case scenario, however please keep in mind that this is only to help get on the right path towards the resolution, as it might not be entirely the solution.
1. I have the following dataset:

As you can see I have 4 supervisors and I have 3 mechanics under each supervisor. My logic for coloring the mechanics is the field Value and the logic is:
- If Value = 1 the mechanic's color is BLUE
- If Value = 2 the mechanic's color is RED
- If Value = 3 the mechanic's color is GREEN
2. Now I have used the following expression to color my mechanics:
If(Value=1, Blue(), if(Value=2, Red(), Green()))
3. The outcome so far is:
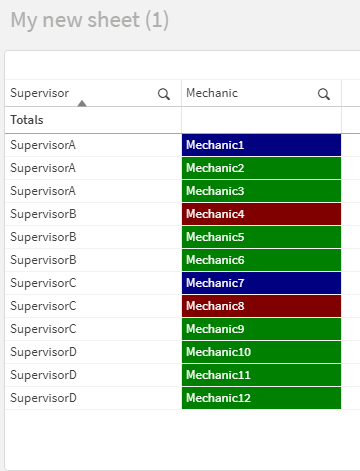
Now based on your logic SupervisorA should appear as BLUE since it has at least 1 BLUE mechanic, SupervisorB should appear as RED since it has at least 1 RED mechanic, SupervisorC will appear BLUE, since there is at least 1 BLUE mechanic and SupervisorD should appear GREEN as all of the mechanics are GREEN.
4. Therefore, we have to implement the logic for the coloring and thus we need to find the patterns. To simplify the issue, I have the initial assumption that there are ONLY 3 mechanics under each Supervisor so I have found the following patterns:
Blue:
- 3 Blue - 0 Green >> Total = 3
- 2 Blue - 1 Green >> Total = 5
- 1 Blue - 2 Green >> Total = 7
- 0 Blue - 3 Green >> Total = 9
Conclusion:
If 3<=X<=7 there is at least 1 BLUE
Red:
- 3 Red - 0 Green >> Total = 6
- 2 Red - 1 Green >> Total = 7
- 1 Red - 2 Green >> Total = 8
- 0 Red - 3 Green >> Total = 9
Conclusion:
If 6<=X<=8 there is at least 1 RED
Green:
3 Green >> Total = 9
Conclusion:
If X=9 then all are GREEN
5. Now we know that all we have to do, is to sum all the values of the field Value for all the mechanics for each supervisor separately and then check to which range does it belong. However, this will only work under the hypothesis that there are only 3 mechanics for each supervisor, therefore we need a more scalable solution.
6. For this, I have used the following expressions:
First we need to count all the mechanics for each supervisor and the expression for that is:
CountMechanicsOfEachSupervisor = Sum(Aggr( NODISTINCT Count(Mechanic), Supervisor)
Then we need to sum all the values of all the mechanics for each supervisor and the expression for that is:
SumValuesForAllMechanicsOfParticularSupervisor = Sum(Aggr( NODISTINCT Sum(Value), Supervisor))
7. Now to make sure that the next complicated expression is simplified, I have created 3 helping variables:
- vBlue with definition 1
- vRed with definition 2
- vGreen with definition 3
8. Final step is to combine the expressions above with If() functions to see each time within which range we are. To do so I have followed the following expression:
If(
SumValuesForAllMechanicsOfParticularSupervisor >= CountMechanicsOfEachSupervisor * '$(vBlue)')
and
SumValuesForAllMechanicsOfParticularSupervisor <= (CountMechanicsOfEachSupervisor - 1) * 3 + '$(vBlue)'),
Blue(),
If(
SumValuesForAllMechanicsOfParticularSupervisor >= CountMechanicsOfEachSupervisor * '$(vRed)')
and
SumValuesForAllMechanicsOfParticularSupervisor <= (CountMechanicsOfEachSupervisor - 1) * 3 + '$(vRed)'),
Red(),
If(
SumValuesForAllMechanicsOfParticularSupervisor = CountMechanicsOfEachSupervisor * '$(vGreen)'),
Green(),
Brown()
)
)
)
You will have to replace the SumValuesForAllMechanicsOfParticularSupervisor with the actual expression and CountMechanicsOfEachSupervisor with the actual expression from above!
Allow me to explain the logic behind it:
- First we get the sum of all values of all mechanics for each supervisor and we check if the value is within the range.
- For the minimum value of each range, we know that it means either all the mechanics are RED or all the mechanics are BLUE respectively.
- Therefore the calculation will be the number of mechanics under each supervisor multiplied by the numeric value that we check for that color, wither 1 for RED or 2 for BLUE respectively.
- For the maximum value of the range we know that either all mechanics are RED except one or all mechanics are BLUE except one.
- Therefore the calculation will be the count of mechanics for each supervisor - 1 and the result multiplied by 3 which is the indication GREEN. After that we add the number 1 for the only mechanic that is RED or 2 for the only mechanic that is BLUE respectively.
- Final check is if the sum of all the values equals to the count of all the mechanics for each supervisor multiplied by the number 3 for GREEN.
9. The output is:
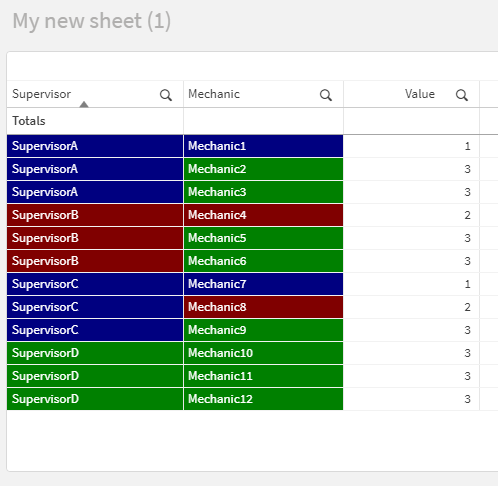
As you can see SupervisorA is BLUE because at least one mechanic is BLUE, SupervisorB is RED because at least 1 mechanic is RED, SupervisorC is BLUE because there is at least one mechanic BLUE and SupervisorD is GREEN because all the mechanics are GREEN.
In your use case scenario I would recommend to use your expressions to generate the values in Data load editor and create the additional field "Value". Because as you can see, the calculations are already complicated. So instead of coloring then your mechanics with the expression you shared, you will just do so with If(Value=1, Blue(), if(Value=2, Red(), Green())) since the values will be already calculated!
As I have mentioned above, this might not be a complete solution for your use case scenario, however it might help you get on the right path towards the resolution!
- Mark as New
- Bookmark
- Subscribe
- Mute
- Subscribe to RSS Feed
- Permalink
- Report Inappropriate Content
What is the logic for coloring Mech?
- Mark as New
- Bookmark
- Subscribe
- Mute
- Subscribe to RSS Feed
- Permalink
- Report Inappropriate Content
Hi Almen,
Thanks for your reply. Below is the mechanic text color logic..
If((aggr(Sum(Sales),Mechanic)/aggr(sum(SalesObjective),Mechanic)) >0.90,RGB(146,208,80),
If((aggr(Sum(Sales),Mechanic)/aggr(sum(SalesObjective),Mechanic))>=0.70, RGB(255,191,0),RGB(255,0,0)))
- Mark as New
- Bookmark
- Subscribe
- Mute
- Subscribe to RSS Feed
- Permalink
- Report Inappropriate Content
Hello,
I have for you an example that might help you achieve the use case scenario, however please keep in mind that this is only to help get on the right path towards the resolution, as it might not be entirely the solution.
1. I have the following dataset:
As you can see I have 4 supervisors and I have 3 mechanics under each supervisor. My logic for coloring the mechanics is the field Value and the logic is:
- If Value = 1 the mechanic's color is BLUE
- If Value = 2 the mechanic's color is RED
- If Value = 3 the mechanic's color is GREEN
2. Now I have used the following expression to color my mechanics:
If(Value=1, Blue(), if(Value=2, Red(), Green()))
3. The outcome so far is:
Now based on your logic SupervisorA should appear as BLUE since it has at least 1 BLUE mechanic, SupervisorB should appear as RED since it has at least 1 RED mechanic, SupervisorC will appear BLUE, since there is at least 1 BLUE mechanic and SupervisorD should appear GREEN as all of the mechanics are GREEN.
4. Therefore, we have to implement the logic for the coloring and thus we need to find the patterns. To simplify the issue, I have the initial assumption that there are ONLY 3 mechanics under each Supervisor so I have found the following patterns:
Blue:
- 3 Blue - 0 Green >> Total = 3
- 2 Blue - 1 Green >> Total = 5
- 1 Blue - 2 Green >> Total = 7
- 0 Blue - 3 Green >> Total = 9
Conclusion:
If 3<=X<=7 there is at least 1 BLUE
Red:
- 3 Red - 0 Green >> Total = 6
- 2 Red - 1 Green >> Total = 7
- 1 Red - 2 Green >> Total = 8
- 0 Red - 3 Green >> Total = 9
Conclusion:
If 6<=X<=8 there is at least 1 RED
Green:
3 Green >> Total = 9
Conclusion:
If X=9 then all are GREEN
5. Now we know that all we have to do, is to sum all the values of the field Value for all the mechanics for each supervisor separately and then check to which range does it belong. However, this will only work under the hypothesis that there are only 3 mechanics for each supervisor, therefore we need a more scalable solution.
6. For this, I have used the following expressions:
First we need to count all the mechanics for each supervisor and the expression for that is:
CountMechanicsOfEachSupervisor = Sum(Aggr( NODISTINCT Count(Mechanic), Supervisor)
Then we need to sum all the values of all the mechanics for each supervisor and the expression for that is:
SumValuesForAllMechanicsOfParticularSupervisor = Sum(Aggr( NODISTINCT Sum(Value), Supervisor))
7. Now to make sure that the next complicated expression is simplified, I have created 3 helping variables:
- vBlue with definition 1
- vRed with definition 2
- vGreen with definition 3
8. Final step is to combine the expressions above with If() functions to see each time within which range we are. To do so I have followed the following expression:
If(
SumValuesForAllMechanicsOfParticularSupervisor >= CountMechanicsOfEachSupervisor * '$(vBlue)')
and
SumValuesForAllMechanicsOfParticularSupervisor <= (CountMechanicsOfEachSupervisor - 1) * 3 + '$(vBlue)'),
Blue(),
If(
SumValuesForAllMechanicsOfParticularSupervisor >= CountMechanicsOfEachSupervisor * '$(vRed)')
and
SumValuesForAllMechanicsOfParticularSupervisor <= (CountMechanicsOfEachSupervisor - 1) * 3 + '$(vRed)'),
Red(),
If(
SumValuesForAllMechanicsOfParticularSupervisor = CountMechanicsOfEachSupervisor * '$(vGreen)'),
Green(),
Brown()
)
)
)
You will have to replace the SumValuesForAllMechanicsOfParticularSupervisor with the actual expression and CountMechanicsOfEachSupervisor with the actual expression from above!
Allow me to explain the logic behind it:
- First we get the sum of all values of all mechanics for each supervisor and we check if the value is within the range.
- For the minimum value of each range, we know that it means either all the mechanics are RED or all the mechanics are BLUE respectively.
- Therefore the calculation will be the number of mechanics under each supervisor multiplied by the numeric value that we check for that color, wither 1 for RED or 2 for BLUE respectively.
- For the maximum value of the range we know that either all mechanics are RED except one or all mechanics are BLUE except one.
- Therefore the calculation will be the count of mechanics for each supervisor - 1 and the result multiplied by 3 which is the indication GREEN. After that we add the number 1 for the only mechanic that is RED or 2 for the only mechanic that is BLUE respectively.
- Final check is if the sum of all the values equals to the count of all the mechanics for each supervisor multiplied by the number 3 for GREEN.
9. The output is:
As you can see SupervisorA is BLUE because at least one mechanic is BLUE, SupervisorB is RED because at least 1 mechanic is RED, SupervisorC is BLUE because there is at least one mechanic BLUE and SupervisorD is GREEN because all the mechanics are GREEN.
In your use case scenario I would recommend to use your expressions to generate the values in Data load editor and create the additional field "Value". Because as you can see, the calculations are already complicated. So instead of coloring then your mechanics with the expression you shared, you will just do so with If(Value=1, Blue(), if(Value=2, Red(), Green())) since the values will be already calculated!
As I have mentioned above, this might not be a complete solution for your use case scenario, however it might help you get on the right path towards the resolution!