Unlock a world of possibilities! Login now and discover the exclusive benefits awaiting you.
- Subscribe to RSS Feed
- Mark as New
- Mark as Read
- Bookmark
- Subscribe
- Printer Friendly Page
- Report Inappropriate Content
Now that the waves from last week’s post about Count(distinct …) have settled, it is time for me to draw some conclusions.
First, I must say that it is astonishing that no one – including myself – sooner openly questioned the assertion that Count(distinct) is single-threaded and slow. We have all had plenty of time to do so: It is true that Count(distinct) was single-threaded and slow in version 7.52, but it was fixed already for version 8 (I double-checked it), which was released in 2007.
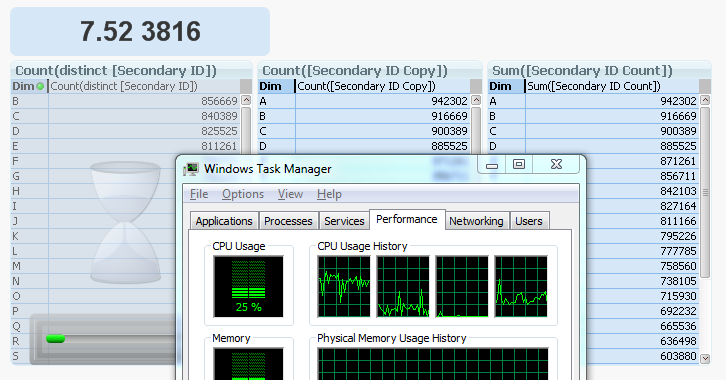
By the way, you can see what it looks like in 7.52 in the picture below. The two charts to the right are both finished, but the Count(distinct …) to the left is still calculating, using only one of the four cores (CPU usage = 25%). Hence, slow and single-threaded.
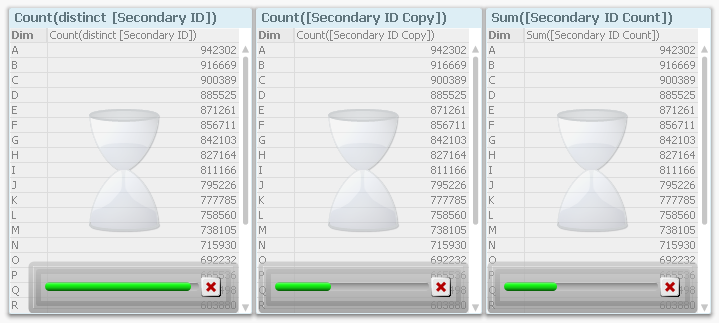
Compare this with the corresponding screen dump from 11.20, where it is obvious from the progress bars that Count(distinct...) is faster than the alternative ways to calculate the same number.
My first conclusion is that we need to sometimes challenge “the truth”. Because, in the software world, the truth changes. What was true yesterday is not necessarily true tomorrow. And if the map and the reality conflict, one must never forget that the map is only an incomplete model of the real world...
Further, from a technical perspective, we can see that:
- Charts are calculated faster if the fields used for the aggregation reside in the largest table, in the fact table. This becomes especially true when the fact table is large.
- Charts are calculated slightly faster if also the dimension fields reside in the fact table.
- The above conclusions are valid only if there is an “external” dimension involved, i.e. that the chart needs to make the calculation linking over the fact table. A single number in a text box, or chart where the fact table isn't involved, will not be affected the same way.
Does this mean that you should join everything together into one, single, de-normalized fact table? For fact tables with very many records, the answer is probably “Yes”. In such cases, you will most likely need to optimize for speed, and then you should probably put everything in one table.
But when doing so, the app uses more RAM. Further, you lose clarity, as Jay Jakosky points out already in a comment of the previous blog.
A normalized model usually has a simpler script, and is easier to understand for the person that has to maintain the application or develop it further. It is simpler to make modifications, to add tables or calculations, and to create correct formulae, if the data model and the script are conceptually simple. So for smaller data sets, where the chart response time already is acceptably low, I claim that you should not optimize for speed.
Instead, you should optimize for clarity and maintainability, which means keeping things simple; i.e. keeping the data model normalized. See more in To Join or not to Join.
Bottom line: Keep it as simple as possible, and don’t make unnecessary optimizations.
"Premature optimization is the root of all evil." - Donald Knuth
You must be a registered user to add a comment. If you've already registered, sign in. Otherwise, register and sign in.