Unlock a world of possibilities! Login now and discover the exclusive benefits awaiting you.
Welcome to
Qlik Community!
Recent Discussions
-
Are there any recent versions of the document titled "Natural Language Query Fea...
Greetings! I am looking for the most recent version of the document titled "Natural Language Query Features", December 2019. Please see attachment of... Show MoreGreetings!
I am looking for the most recent version of the document titled "Natural Language Query Features", December 2019. Please see attachment of the doc I am referring to.
Cheers,
++José
-
Accumulate and calculate running numbers from ingoing balance and running change...
Hi, I'm working on financial KPI's and want to use the balance sheet as well as the P&L for analysis. The differences is that in the balance sheet you... Show MoreHi,
I'm working on financial KPI's and want to use the balance sheet as well as the P&L for analysis.
The differences is that in the balance sheet you have an ingoing balance and then the changes during the month is booked and then you get an outgoing balance, in my dataset there is no ingoing balances available from the database from any tables that I've found.
I want to to a rolling 12 months analysis on inventory turnover rate and need to be able to calculate averages for a twelve months period every month ending to get this KPI.
I've added the ingoing balance for 2021-05-01 manually and concatenated with the transaction data, from this I can get an outgoing balance every month with RangeSum and Above where I've set period of times to 100000, (maybe there is a smarter way) which gives me the outgoing balance every month.
RangeSum(Above(Sum({<Sub_Group={'Inventory'}>}Amount),0,100000),)
How do I use this? I need to bring the value from 2021-05-01 to 2024-03-31 for example to be able to get my outgoing balance for 2024-03-31, see example below.
Is there a way to make a calculated field instead to use in set analysis or any other way that is more simple just shoot with ideas!
Help much appreciated, thanks!
-
Chart table Column sub headers
Dear all,I have a chart table with number of records. That because i need to group them in to sub headers like this.. pls help this is an urgent matte... Show MoreDear all,
I have a chart table with number of records. That because i need to group them in to sub headers like this..
pls help this is an urgent matte...


-
Job failing with error unable to rename repcmd.log
We are triggering replicate by using scheduling tool and periodically checking the status if replicate completed or not. Although the replicate load i... Show MoreWe are triggering replicate by using scheduling tool and periodically checking the status if replicate completed or not. Although the replicate load is going success the job is failing with the error Failed to rename file repcmd.log to repcmd__240417043324.log .
-
Iterate tRest API call with dynamic body
Hi everyone, I'm having trouble with a task and need some help. I have two tables: One with all the products in a CRM - (ImportedProducts) One with a... Show MoreHi everyone, I'm having trouble with a task and need some help.
I have two tables:
- One with all the products in a CRM - (ImportedProducts)
- One with all the products and prices from an ERP - (PricebookView)
I want to update the prices of all the products in the CRM (ImportedProducts) based on the prices in PricebookView. To do this, I need to make multiple API calls with the following structure:
URL: www.url.com/products/ {productid} where {productid} is dynamic and represents the ID I have in ImportedProducts
BODY (to update the subtotal, for example):
JSON{ "subtotal": {price} }where {price} is the price for the {productid} in the URL. Of course, there are many prices to update.
I've implemented the basic job functionality, but I'm stuck on how to pass dynamic values to the URL and body. Any suggestions? Thanks!
Here the actual job has an error (Syntax error on token "") }"", delete this token. But I think this is not only a syntax error but a structure error.
-
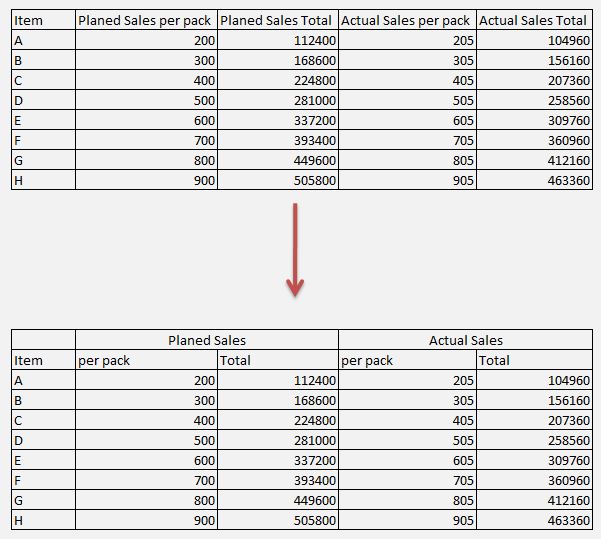
Merged Column Headers in Table
Can anyone explain how to create merged column headers in a table? I.e.Group Column Header 1 | Group Column Header 2Sales| Region| Country| ... Show MoreCan anyone explain how to create merged column headers in a table? I.e.
Group Column Header 1 | Group Column Header 2
Sales| Region| Country| Product|Price|Distributor|
Right now I have ValueList(Header1, Header2) dimension and expressions conditional on ValueList(Header1, Header2)='Header 1'
but the table says all expression are disabled.
Thanks
-
Show zero measures in a graph
(Apologies, this was posted earlier but was my post was so full of flaws, I removed it). I am trying to show a graph of tickets raised over a periiod ... Show More(Apologies, this was posted earlier but was my post was so full of flaws, I removed it).
I am trying to show a graph of tickets raised over a periiod of time. In my data I have zero 'Open' tickets in October and as a result October does not show on my graph.
I have tried a 'Master Calendar' which works until a filter is applied. -
I have also read about adding + sum({1}0) to my measure.
Count({<[Status]={'Open'}>}id) + sum({1}0)
and setting the Addons -> Data Handling -> Include zero values
Any help would be appreciated
-
How can I color negative values and positive values in QlikView?
Hello, How can I color negative values red and positive values green in QlikView? -
Percent of Total in Pivot Table
Hello-I like the Pivot Table functionality because it allows me to drill through to the details in another table. A straight table allows that, but no... Show MoreHello-
I like the Pivot Table functionality because it allows me to drill through to the details in another table. A straight table allows that, but not as well in my example. Mainly because I need two dimensions.
I have included in the attached doc some options.
In the end I want a table that looks like this. I can re-model the data if needed so I am open to any suggestions.
Yes No Total %Yes Red 50 16 66 76% Orange 57 62 119 48% Black 30 18 48 63% Green 98 38 136 72% When I click on the 16 for No/Red I would like to just see those 16 detail records. While I can get a straight table to look the way I want, I can not get it to select the data I want (Because I am using Set Analysis instead of the Dimension as a Dimension in the chart)
-
compatibility question
Hello, Is it possible to have a Qlik Enterprise manager version November 2023 hosted on a Windows server, that manages Linux hosted Qlik Replicate ser... Show MoreHello,
Is it possible to have a Qlik Enterprise manager version November 2023 hosted on a Windows server, that manages Linux hosted Qlik Replicate server, version May 2022?


Lots of Qlik Talend Data Integration Sessions!
Wondering about Qlik Talend Data Integration Sessions? There are 11, in addition to all of the Data & Analytics. So meet us in Orlando, June 3 -5.

Qlik Community How To's
Browse our helpful how-to's to learn more about navigating Qlik Community and updating your profile.

Do More with Qlik - Delivering Real-Time, Analytics-Ready Data
Join us on April 24th at 10 AM ET for the next Do More with Qlik webinar focusing on Qlik’s Data Integration & Quality solutions.

Your journey awaits! Join us by Logging in and let the adventure begin.


Customer Story
Qlik Data Integration & Qlik Replicate story
Qlik enables a frictionless migration to AWS cloud by Empresas SB, a group of Chilean health and beauty retail companies employing 10,000 people with 600 points of sale.
Customer Story
Building a Collaborative Analytics Space
Qlik Luminary Stephanie Robinson of JBS USA, the US arm of the global food company employing 70,000 in the US, and over 270,000 people worldwide.
Location and Language Groups
Choose a Group
Join one of our Location and Language groups. Find one that suits you today!
Healthcare User Group
Healthcare User Group
A private group is for healthcare organizations, partners, and Qlik healthcare staff to collaborate and share insights..
Japan Group
Japan
Qlik Communityの日本語のグループです。 Qlik製品に関する日本語資料のダウンロードや質問を日本語で投稿することができます。
Brasil Group
Brazil
Welcome to the group for Brazil users. .All discussions will be in Portuguese.
Blogs
Community News
Hear from your Community team as they tell you about updates to the Qlik Community Platform and more!