Unlock a world of possibilities! Login now and discover the exclusive benefits awaiting you.
- Qlik Community
- :
- All Forums
- :
- QlikView App Dev
- :
- Re: How to create this chart in Qlikview?
- Subscribe to RSS Feed
- Mark Topic as New
- Mark Topic as Read
- Float this Topic for Current User
- Bookmark
- Subscribe
- Mute
- Printer Friendly Page
- Mark as New
- Bookmark
- Subscribe
- Mute
- Subscribe to RSS Feed
- Permalink
- Report Inappropriate Content
How to create this chart in Qlikview?
HI All,
Please find below the below figure,I'M facing problem creating the chart column in this chart.Do anyone have an idea how can i re-create this chart in qlikview.Thank you.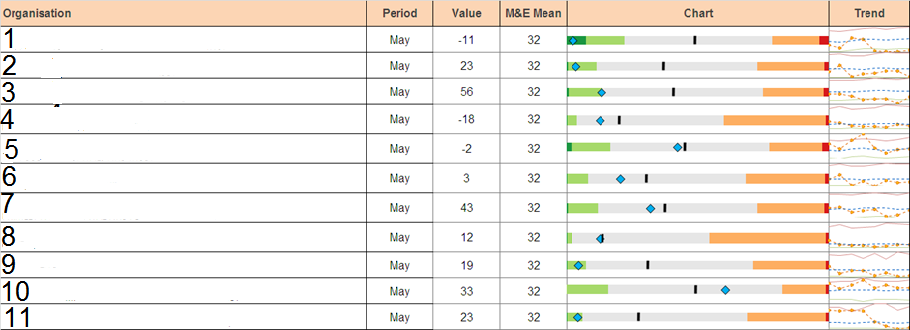
- « Previous Replies
-
- 1
- 2
- Next Replies »
- Mark as New
- Bookmark
- Subscribe
- Mute
- Subscribe to RSS Feed
- Permalink
- Report Inappropriate Content
Correcting myself, this solution does work on ajax, plugin and desktop - as long as you have an internet connection available.
- Mark as New
- Bookmark
- Subscribe
- Mute
- Subscribe to RSS Feed
- Permalink
- Report Inappropriate Content
But Still the segments seems to be the same for the entire dimension.
- Mark as New
- Bookmark
- Subscribe
- Mute
- Subscribe to RSS Feed
- Permalink
- Report Inappropriate Content
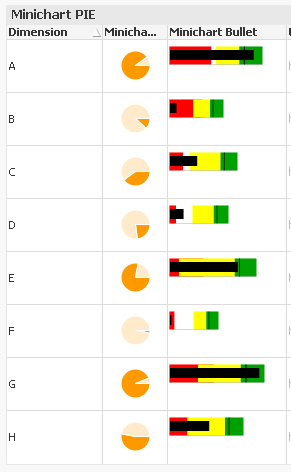
In the example I only changed the black bar, but you can as easily change the segments / colors, vertical marker, even image size, bar length or width, or whatever. Think of each image (cell in a row) as a text that you can build from that dimension's data, so yes, the segments can be different for each row, like so:
- Mark as New
- Bookmark
- Subscribe
- Mute
- Subscribe to RSS Feed
- Permalink
- Report Inappropriate Content
Hi Jordi,
Thanks for the solution using google api charts. I had a similar requirement and I am planning to use this. But I noticed that when I turn the 'webview' of my qlik desktop ON, the chart disappear exposing the URL behind. I have an internet connection. The charts render as required in my qlikview desktop when the webview is OFF. Any idea why this is so. Should I change any settings to enable it in webview ? This makes me skeptical of whether this would work when deployed in access point.
Regards,
Vishnu
- « Previous Replies
-
- 1
- 2
- Next Replies »