Unlock a world of possibilities! Login now and discover the exclusive benefits awaiting you.
- Qlik Community
- :
- All Forums
- :
- QlikView App Dev
- :
- Drill through Reporting requirement
- Subscribe to RSS Feed
- Mark Topic as New
- Mark Topic as Read
- Float this Topic for Current User
- Bookmark
- Subscribe
- Mute
- Printer Friendly Page
- Mark as New
- Bookmark
- Subscribe
- Mute
- Subscribe to RSS Feed
- Permalink
- Report Inappropriate Content
Drill through Reporting requirement
Hi,
I am new to Qlickview and I have drill through reporting requirement
I need to implement the drill through report (From the summery report to the detailed report)
Eg We have summery report with following aggregated info
Region Sales
India 10000
Chaina 40000
Malaysia 5000
And current selection in the summery reports is Year = 2014
When we click on the Sale summery of particular region then the associated detail report should launch
Ie
Region Product price quantity
India Prod 1 10 2
India Prod 2 5 4
India Prod 1 7 4 etc
Please provide the step by step process to implement the same in word document (I am using the Qlickview personal server)
- Tags:
- new_to_qlikview
- « Previous Replies
-
- 1
- 2
- Next Replies »
Accepted Solutions
- Mark as New
- Bookmark
- Subscribe
- Mute
- Subscribe to RSS Feed
- Permalink
- Report Inappropriate Content
You could use the function getselectedcount(Region) as well.
- Mark as New
- Bookmark
- Subscribe
- Mute
- Subscribe to RSS Feed
- Permalink
- Report Inappropriate Content
Can you send me some sample data?
- Mark as New
- Bookmark
- Subscribe
- Mute
- Subscribe to RSS Feed
- Permalink
- Report Inappropriate Content
Hi,
Thanks for the help .I have attached the sample data for your reference
PolicyInfo TAB :- Row Data for the report
Summery TAB : - Summery by Region
Detailed TAB :- Expected detailed report when we click on particular region
- Mark as New
- Bookmark
- Subscribe
- Mute
- Subscribe to RSS Feed
- Permalink
- Report Inappropriate Content
Try this
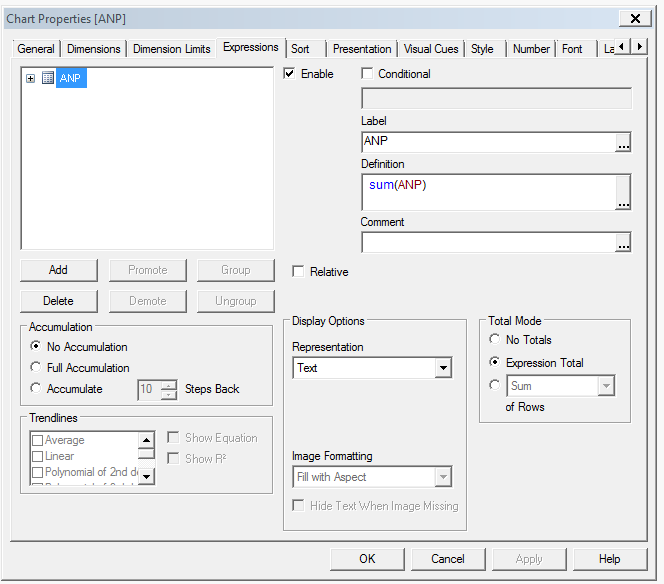
I use sum(ANP) as the expression and put all the demensions in, I then do a conditional show on all the demensions but Region of count(distinct Region)=1 (see attached)
- Mark as New
- Bookmark
- Subscribe
- Mute
- Subscribe to RSS Feed
- Permalink
- Report Inappropriate Content
Thanks for your quick response. It would be great if you can provide me screen capture (Screen shots) for the steps which you followed in test1.qvw (since I am using Qlick View personal edition and I can’t open file from my PC)
- Mark as New
- Bookmark
- Subscribe
- Mute
- Subscribe to RSS Feed
- Permalink
- Report Inappropriate Content
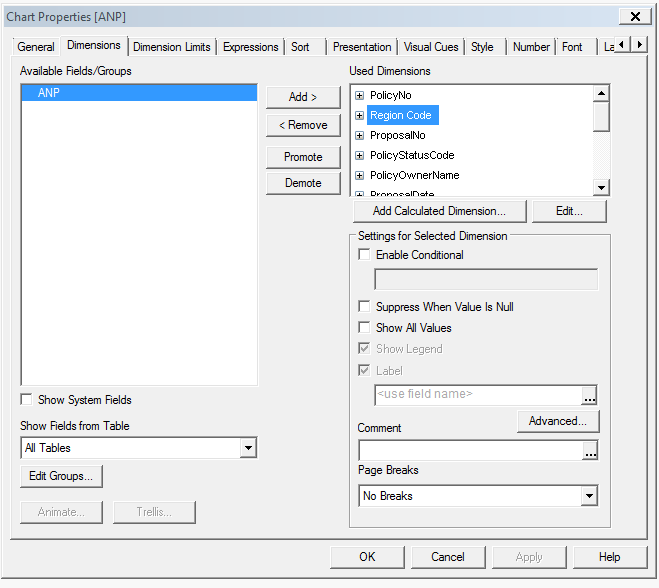
Create a straight table with all your demensions except ANP in it (as per your detail example):
On every Demension but the region tick the Enable condition and enter this
count(distinct [Region Code]) = 1
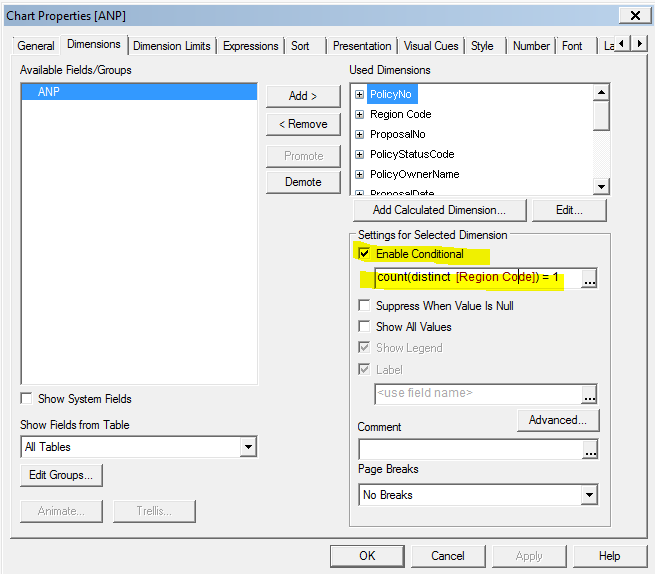
Expression as below:
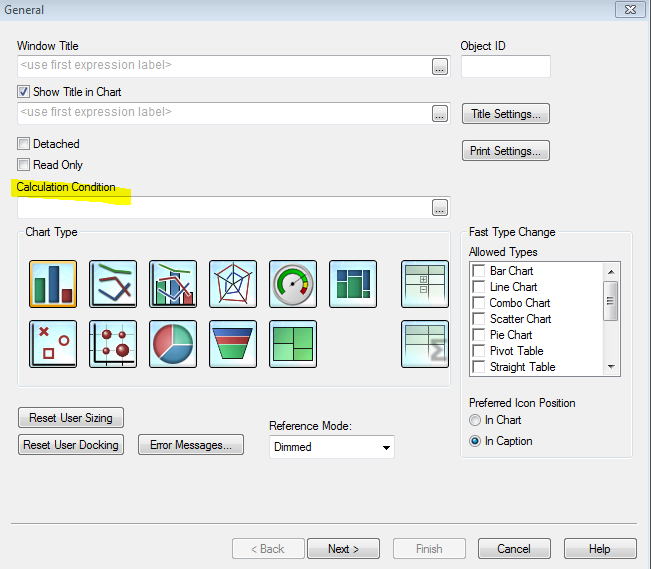
This will create a table that when no region is selected will show you sales by region but once you select a region it will epand to show you each demension and hence the detail level.
- Mark as New
- Bookmark
- Subscribe
- Mute
- Subscribe to RSS Feed
- Permalink
- Report Inappropriate Content
Did this work ok for you?
- Mark as New
- Bookmark
- Subscribe
- Mute
- Subscribe to RSS Feed
- Permalink
- Report Inappropriate Content
Thanks for your help. I have tried the steps and Its enabled me for the drill down option ie. when we click on the region all other attributes displayed .I would require kind of navigation to the new qvw file with all row level information (Since the summery report layout will have other summery information other than the region & ANP so it can’t accommodate entire field level info in the same report)
- Mark as New
- Bookmark
- Subscribe
- Mute
- Subscribe to RSS Feed
- Permalink
- Report Inappropriate Content
Is there any option to launch new report from summery with current field selection
- Mark as New
- Bookmark
- Subscribe
- Mute
- Subscribe to RSS Feed
- Permalink
- Report Inappropriate Content
yes you create 2 charts with a conditional show option with the same criteria as I used for the demensions
- « Previous Replies
-
- 1
- 2
- Next Replies »